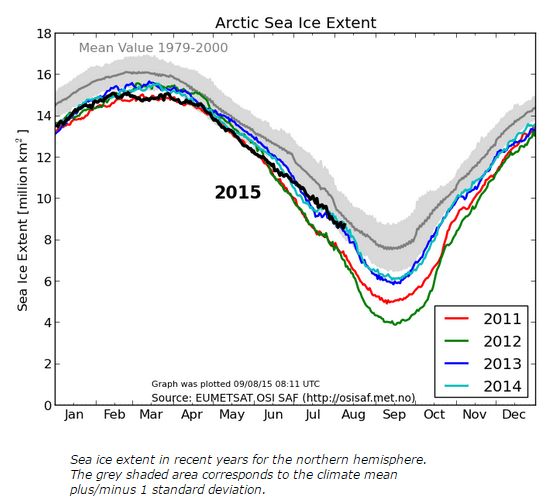
Climate experts say that the Arctic will be ice free in a few weeks.
The actual Arctic has almost exactly normal sea ice, with only a few weeks remaining in the melt season.
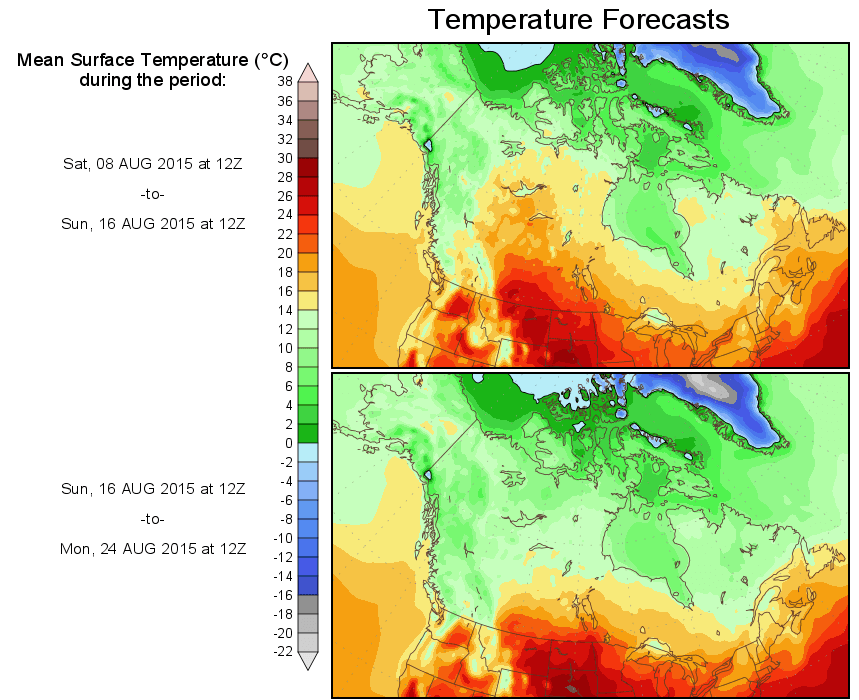
Cold air and clouds has nearly shut down melting.
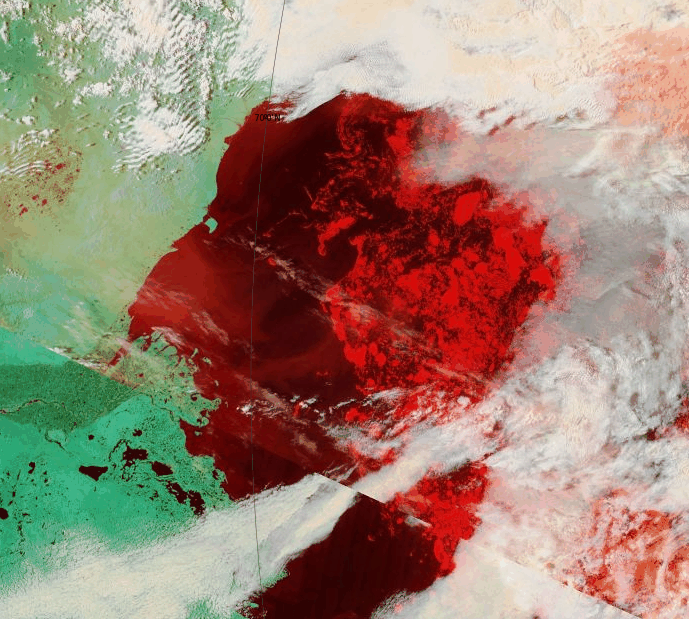
There is a small amount of melting visible at the southern fringes of the Beaufort Sea


Steven, government “experts”
1. Have lied to the public since Stalin won WWII and united nations (UN) and national academies of science into a worldwide “Orwellian Ministry of Consensus Science (UN)Truths“ on October 24, 1945;
2. Were caught manipulating temperature data and lying to the public in the Climategate emails released to the public on late November 2009; and
3. Continue lying to the public and manipulating temperature data to try to protect the structure of post-WWII government-sponsored science from exposure as a tool of post-WWII government propaganda, . . .
that George Orwell predicted in the futuristic novel he started writing in 1946, “Nineteen Eighty-Four!”
Though one should expect some continued “under melting” for a month or so, for all intents and purposes the Arctic melt season appears to be coming to an earlier than normal end. Too cold, too cloudy, too calm. Sunset at the north pole is 46 days away now and the sun is already getting low on the horizon. Then it will be darkness for 176 days.
Should have been clearer in my statement above. There will not be total darkness for 176 days because of the twilight periods. October 6th is about the time it gets night time dark 24/7 and then come next spring there will be a similar period of twilight before the sun actually comes above the horizon.
Anyway we aren’t too far from the time when those that live in Alaska can take the tin foil off their windows.
Keeping in Mind that i am very skeptical of AGW,
I am wondering why cryosphere today is showing an abrupt amount
of Arctic melting, currently 1.706 million square miles.
Steve?
Perhaps strong winds and currents have compacted the ice into a smaller area.
However, why would two sources give such divergent information?
I can’t keep up with your Arctic output Steve! At the risk of repeating myself, what about the big holes in the Beaufort Sea ice currently hiding under the clouds?
http://t.co/dIfoZvpMg4
What about fact that Arctic sea ice is anomalously high compared to most of the rest of the Holocene except the very cold period we have just finished climbing out of
Are you ready to admit the truth yet, Jimbo… or still playing hide and seek under your rock.
as already mentioned jim, depends which satellite data you look at whether you see holes or low concentration ice. it appears there is a bit of a circulation change happening this year . maybe down to the amo heading into the cold phase ?
Maybe down to Steve picking a different cherry? Here’s what his old one looks like today:
http://GreatWhiteCon.info/2015/05/trouble-looming-for-the-arctic/#comment-211243
http://greatwhitecon.info/wp-content/uploads/2015/05/DMI-30-icecover_20150810.png
Jim ‘Sea Ice’ Hunt – Been over your choice of charts previously. You again need to read the description of the charts.
Your Chart pictured says – Please notice, that the sea ice extent in this plot is calculated with the coastal zones masked out. To see the absolute extent, go to this page. http://ocean.dmi.dk/arctic/old_icecover.uk.php
Notice how it says – OLD_ICECOVER
See how ‘go to this page’ is blue with the click link to
http://ocean.dmi.dk/arctic/icecover.uk.php
And what do you see? Just the chart Tony has above.
This Chart pictured says – The plot above replaces an earlier sea ice extent plot, that was based on data with the coastal zones masked out. This coastal mask implied that the previous sea ice extent estimates were underestimated. The new plot displays absolute sea ice extent estimates. The old plot can still be viewed here for a while.
How is the cherry picking going?
Dear DD,
Forgive me, but where have you been for the 2015 Arctic sea ice melting season? I display a wide variety of “charts”. “Steve” is the one who cherry picks the OLD 30% extent graph. Why don’t you do your due diligence and go through all the 2015 Arctic sea ice posts on here and then tell us all which ones use the NEW graph and which ones use the OLD graph?
Meanwhile I called the DMI this morning about the problem with their OLD graph, and they seem to have fixed the problem in their processing pipeline so “Steve” can happily go back to using that one! Please feel free to read all about it at:
http://GreatWhiteCon.info/2015/08/arctic-sea-ice-approaching-normal/
“almost exactly” is the wordier version of ”nearly”. It is the scientific equivalent of Theory First, posit hypothesis second, then begin Speculation, and finally if and only if necessary begin collecting data.
May have to right-click open-in-new-tab to see up to date..
but even NDISC is showing melt is currently below normal.
http://nsidc.org/greenland-today/images/greenland_melt_area_plot_tmb.png
why does it do that !!!!
DMI also show melt significantly below normal.
Again, you may have to right-click open-in-new-tab to see up to date..
http://beta.dmi.dk/uploads/tx_dmidatastore/webservice/e/n/i/b/m/Melt_combine.png
Poor guys trying to live in the Arctic, they could really use some open free navigable ocean.. just once. This continued high level of sea ice must be a real pita !!!
yep, graph is way out of date again !! arghhh !!! open in new tab
NDISC -> NSIDC !