
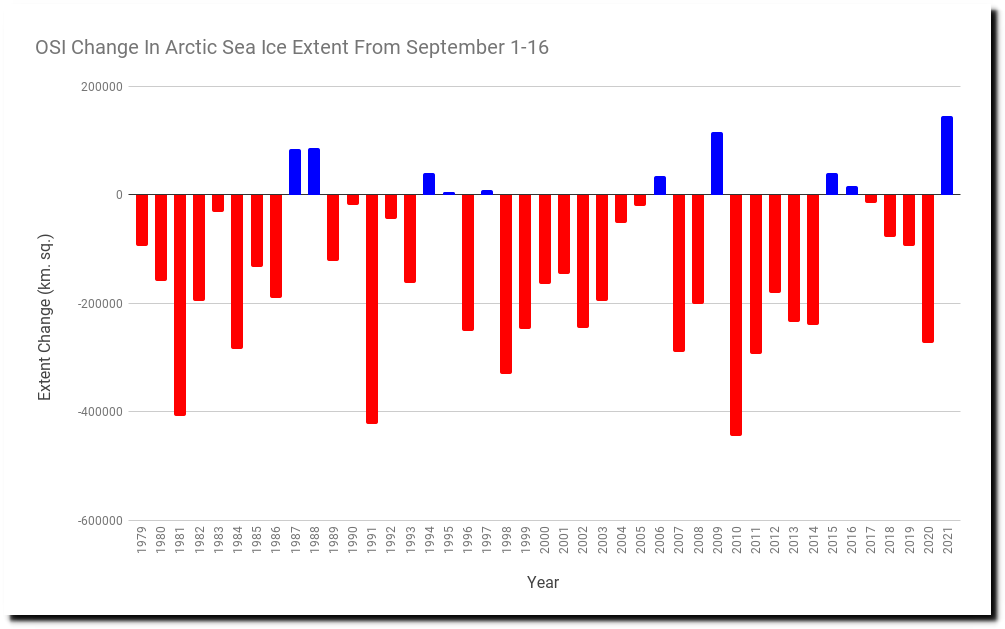
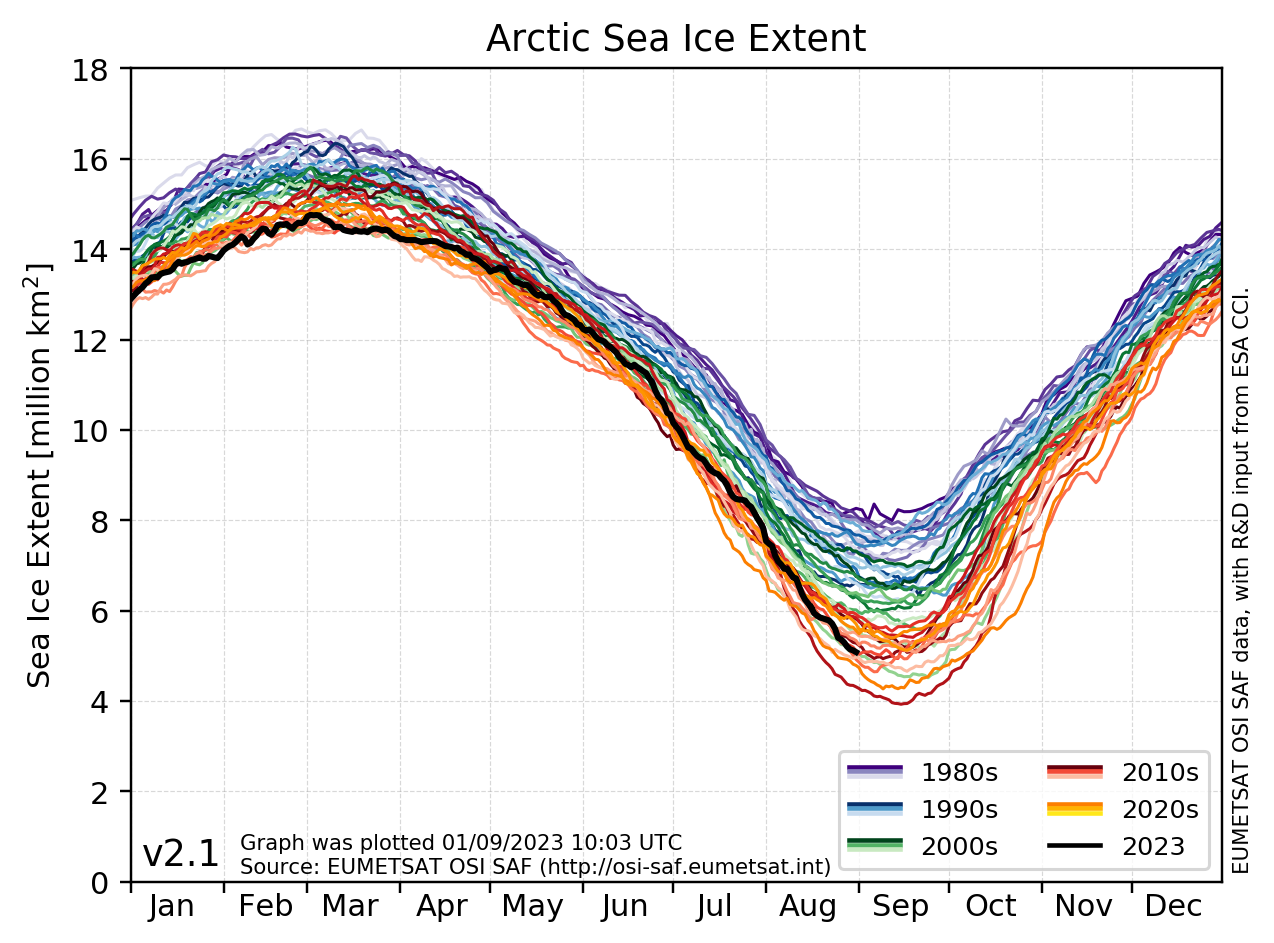
During the first sixteen days of September, Arctic sea ice extent increased by a record amount.
ftp://osisaf.met.no/prod_test/ice/index/v2p1/nh/osisaf_nh_sie_daily.txt
Extent is up 27% since this date last year.
osisaf_nh_sie_daily-all.png (1274×943)
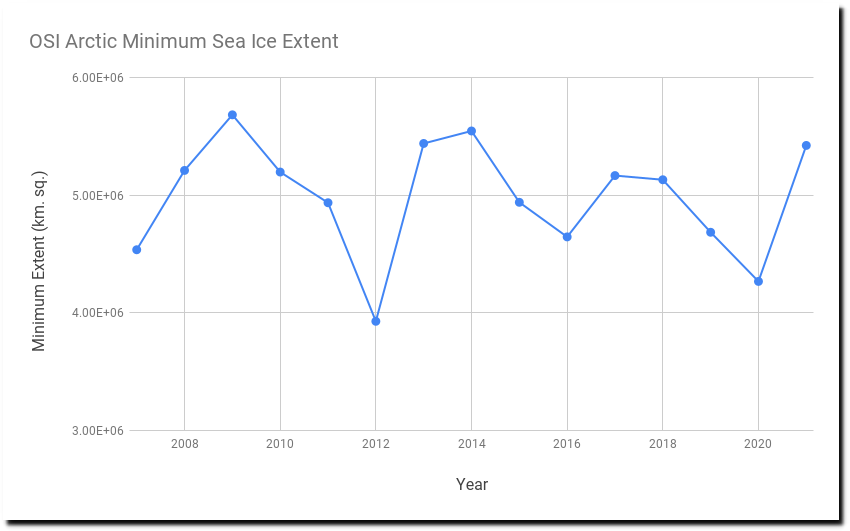
There has been no trend in minimum sea ice extent over the past fifteen years.
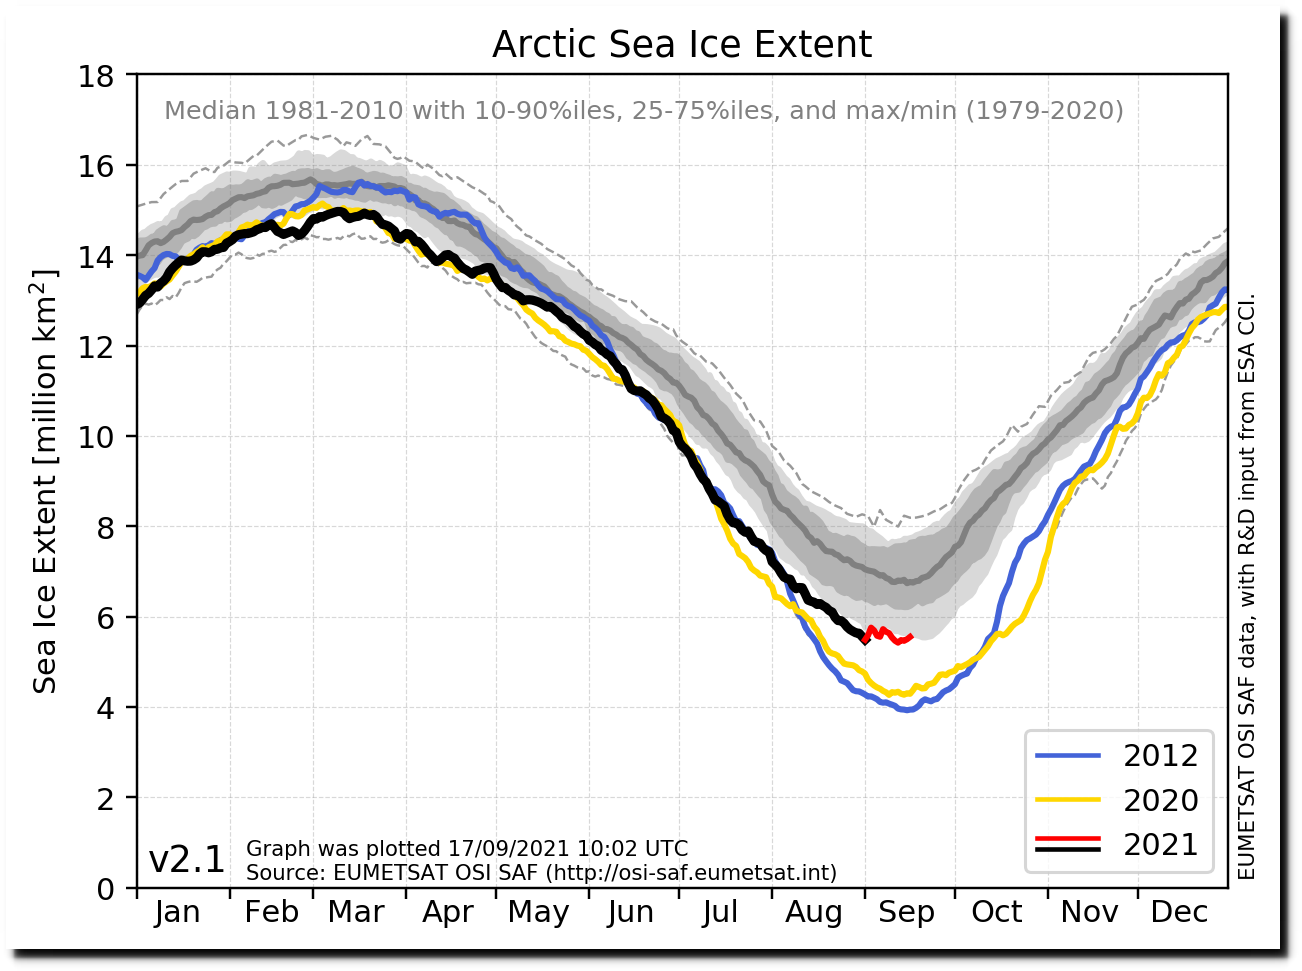
Sea ice extent in the western Arctic is higher than 40 years ago.
20210913180000_CVCHDCTWA_0011761430.gif (1100×850)
Experts say sea ice is melting at a record rate and it causing all sorts of bad weather.
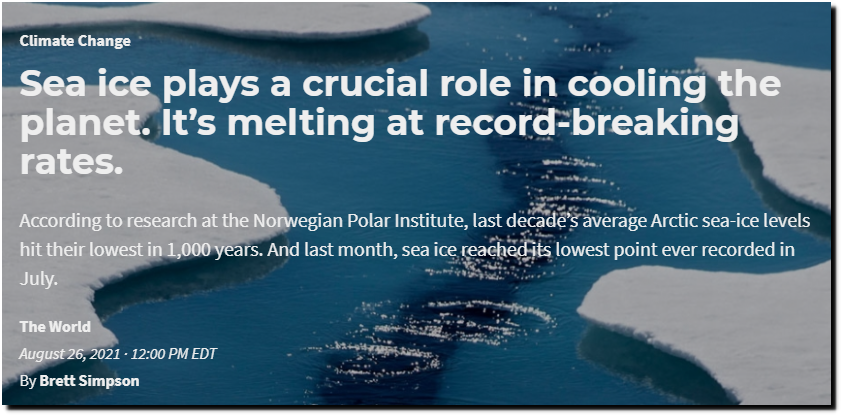
Sea ice is melting at record-breaking rates
The claims of record melt this year have nothing to do with reality, but the ones in 1911 were more accurate.
“Reports from Baffin Bay and the other waters around Greenland also – tell of an unprecedented melting of the arctic ice fields. It is probable that an arctic explorer had happened to be in the far north this summer he, would have been able to get fairly close to the Pole in boats. Some say that the melting of the arctic ice cap is one of the direct results of the abnormally hot weather this summer, while others hold that the hot weather is the result of the melting lee and the release of an unusual amount of heat from the warmer ocean water. Thus it Is the same old question as to which is the cause and which the effect. Astronomers studying the planet Mars have noted an unusual melting of the ice- cap on that planet”
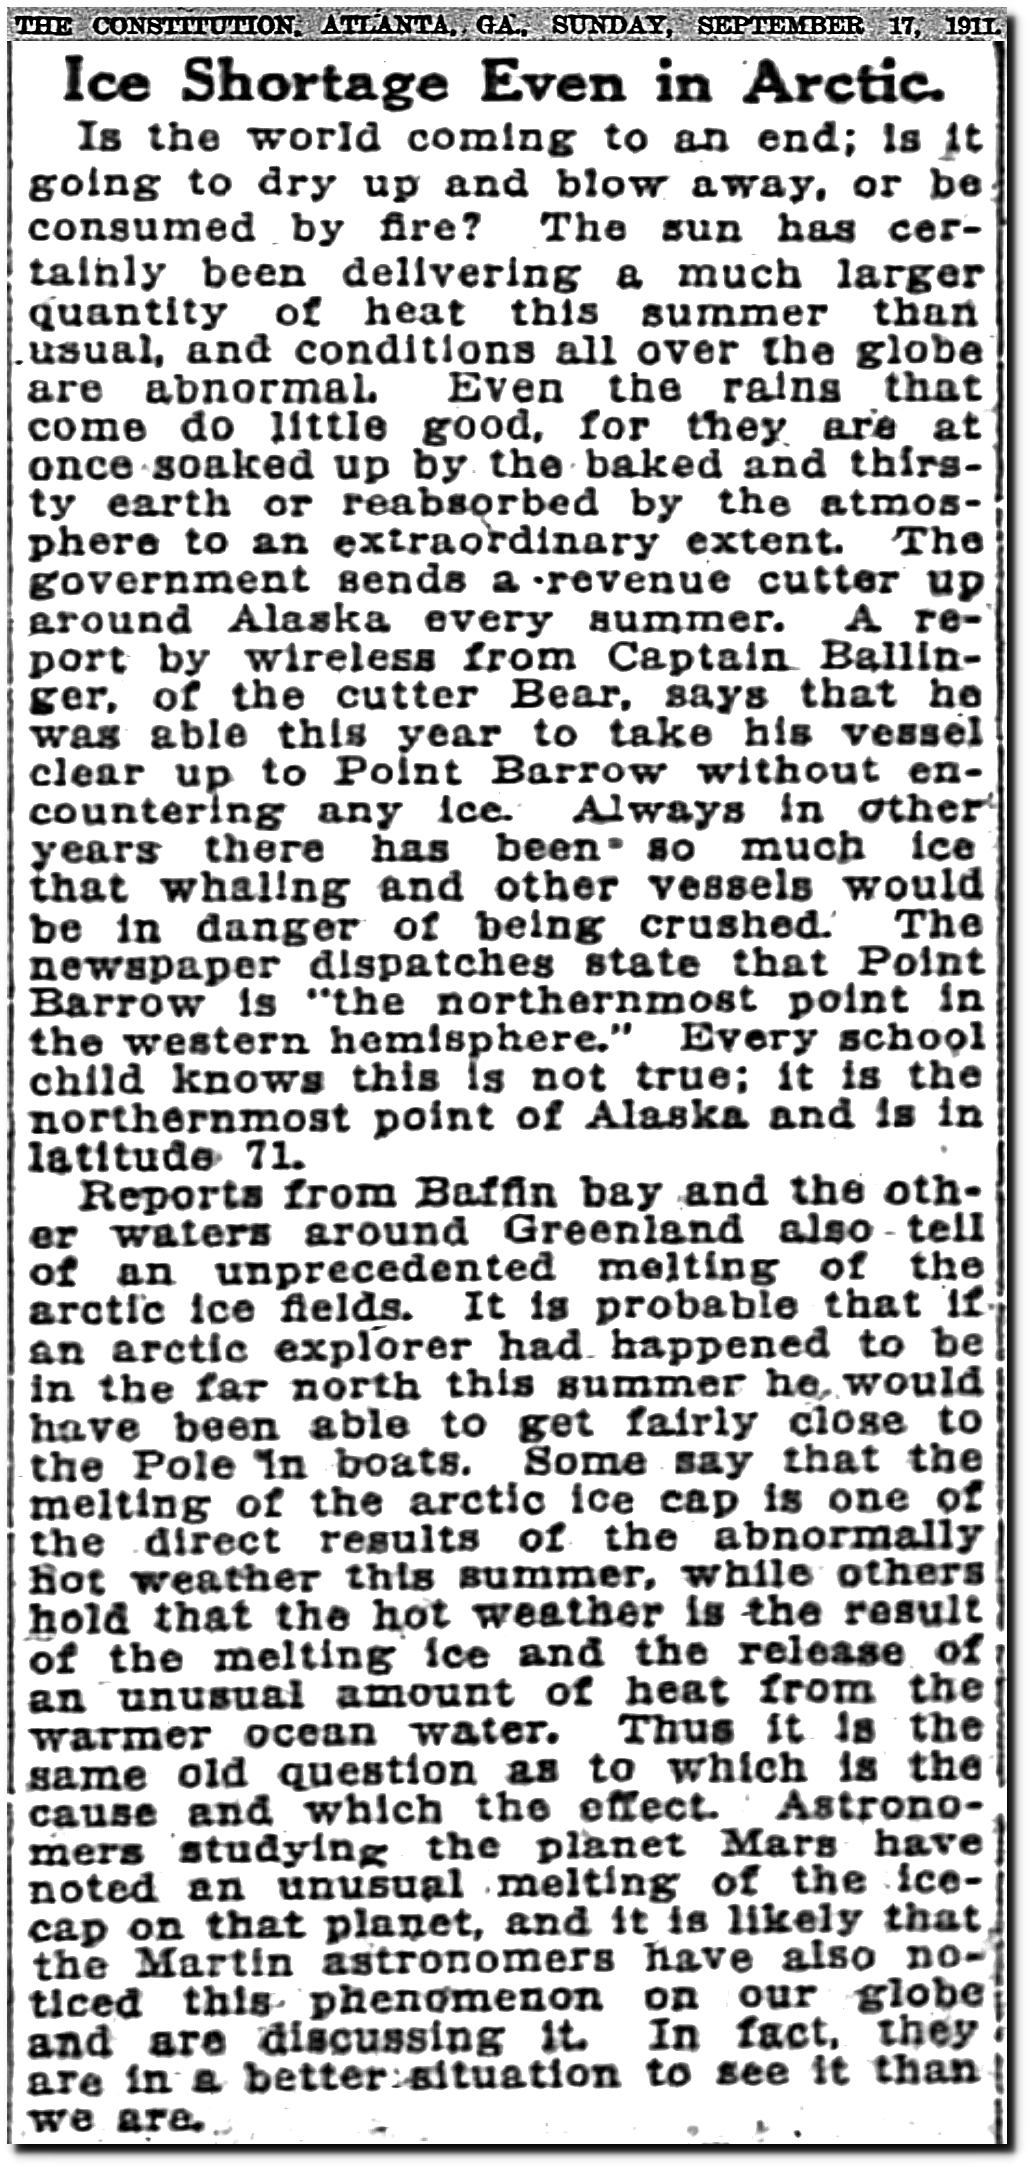
17 Sep 1911, Page 6 – The Atlanta Constitution at Newspapers.com
h/t Don Penim
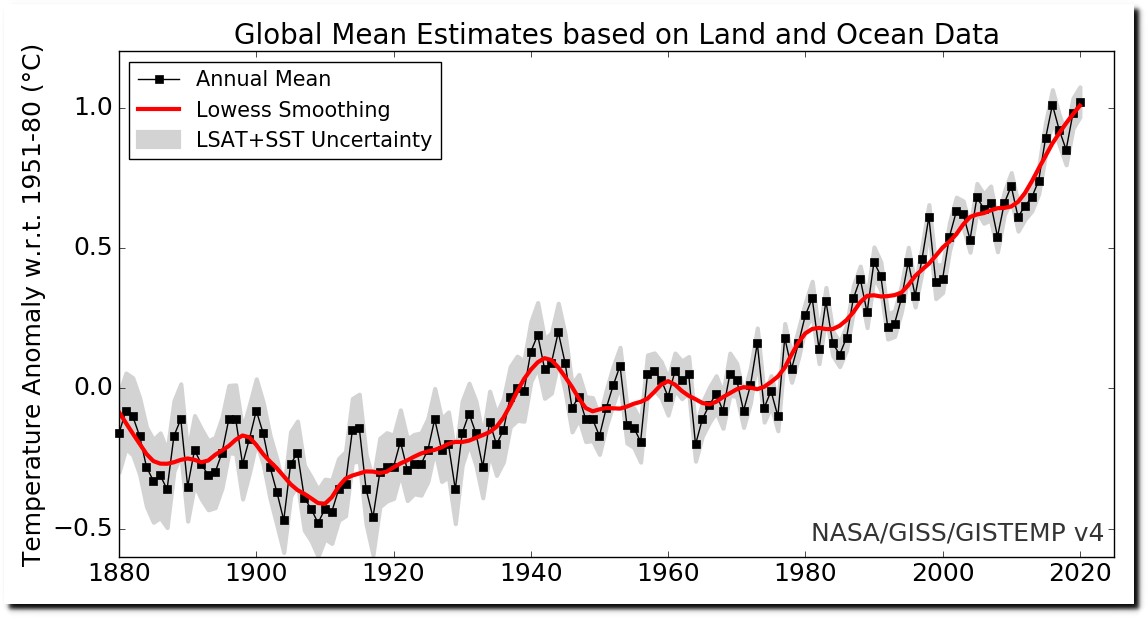
NASA says 1911 was one of the coldest years on record.
