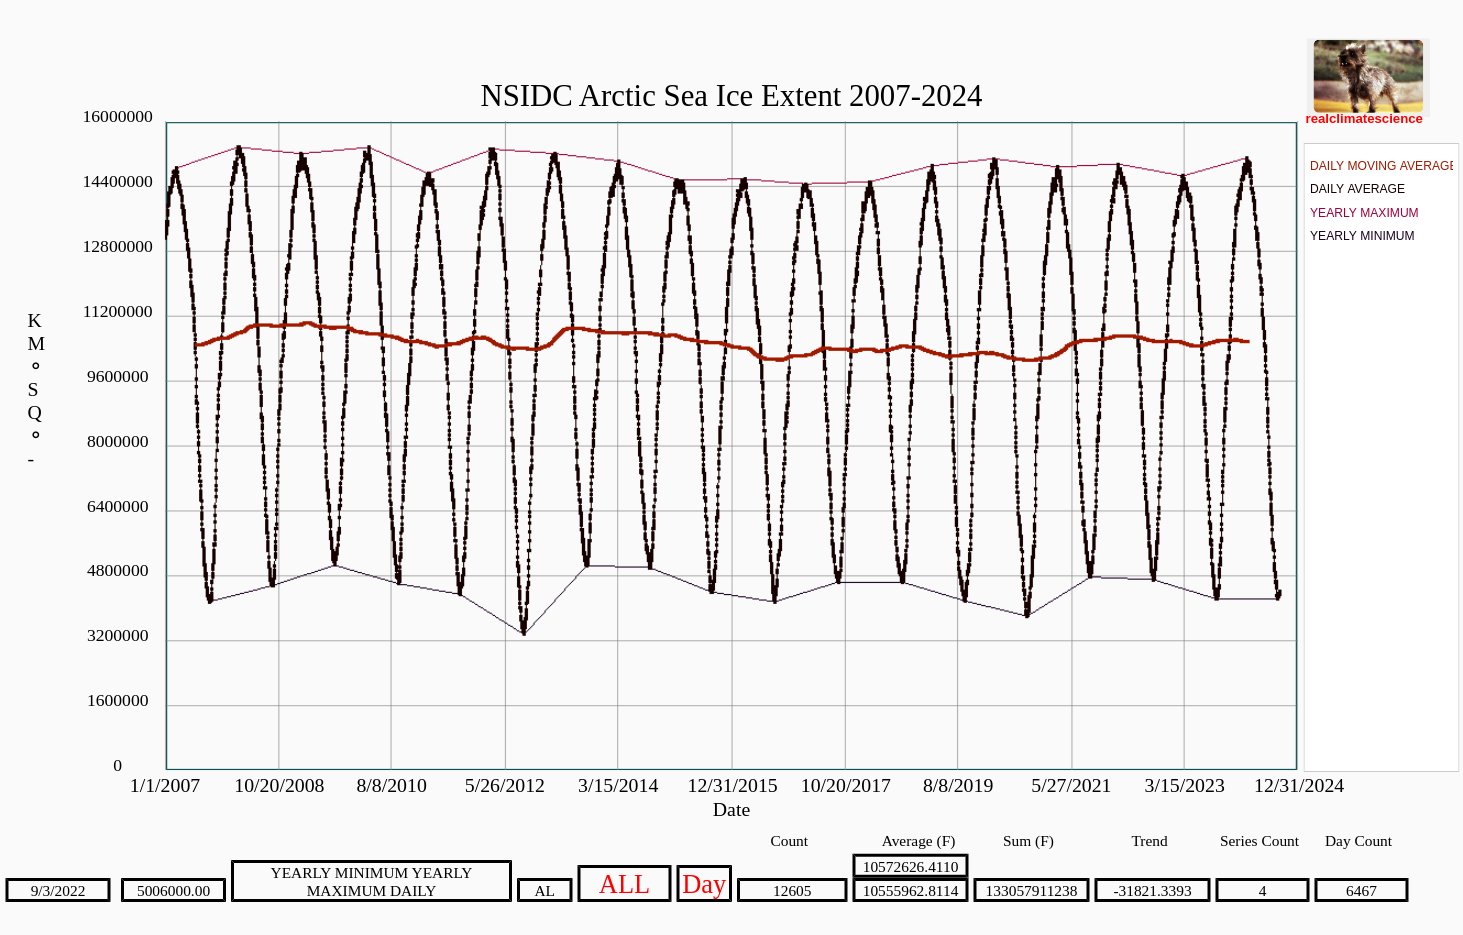
Arctic sea ice area has been increasing at a record rate during the first three weeks of September.
ftp://osisaf.met.no/prod_test/ice/index/v2p2/nh/osisaf_nh_sia_daily.txt
osisaf_nh_sia_daily-all.png (1274×943)
N_20240907_extn_v3.0.png (420×500)
N_20240920_extn_v3.0.png (420×500)
If current trends continue, there will still be Arctic sea ice when Greta Thunberg is 500 years old.


being that I’m a little bit of a nerd, for many years I’ve been getting my current arctic ice cover by googling three words: Arctic ice Denmark. occasionally they won’t update their info for a week because probably somebody’s on vacation but lately they haven’t updated their info for 4 weeks. very odd. so I looked for another source and that’s called sea ice today. their info seems to be incomplete for the past 2 weeks. i wonder why. the source that Mr Tony Heller is using, im unfamiliar with. I found their website but I can’t find the graph that Mr Tony Heller is using, on their website. aside from that, is it possible that we have competing websites that use different criteria to determine what counts as sea ice coverage? oh my God has that become political too? uffta
Bob / Tony … I copied Benice’s comment over at WUWT : But does anyone know what has happened to the Arctic sea ice data? NSIDC and OSI both have a several day gap from about 12th to 17th Sept, but after that NSIDC stays about level, but OSI climbs rather quickly. MASIE doesn’t have the gap in the data, but seems to show a decrease over the last few days.
For my two cents …. the DMI data is FUBAR from Aug 26th (temperature) or early Sept for sea ice. The DMI ice temperature data seems fine but who knows.
Something rather odd going on.
I just had to look at the Denmark site and it has not updated arctic ice cover for a month. the national snow and ice center shows that arctic ice cover is virtually unchanged the last 3 weeks. I’m confused.
Likely more than a small problem but looking around the DMI website I read about layoffs ~6 years ago and perhaps there were more. Some parts ie Greenland ice mass balance seems more active and perhaps that is where the attention & dollars are going.
The other DMI sites might be automatic data scraping and posting and largely forgotten and no one cares that they’re down.
BIG TIME BUMMER as the melt ending is a biggy for both sceptics and alarmist.
Stewart, maybe we’re just being impatient. it takes time to doctor the data. lol
BINGO …. and unfortunately all too true. I remember when DMI killed the sea ice graph that wasn’t showing the low ice levels and blamed it on the graph using a coastal mask that wasn’t as accurate as the newer versions. Funny how the newer “improved” versions always show less ice …. never more sea ice.
I did a little more digging. appears to me the source for current arctic ice cover comes from the same place. but they have two graphs that are different. called level 2 and the other one is level 3. they use different definitions of what counts as ice cover. both are correct… just depends what you’re looking for.