http://data.giss.nasa.gov/gistemp/2010july/figure2.pdf
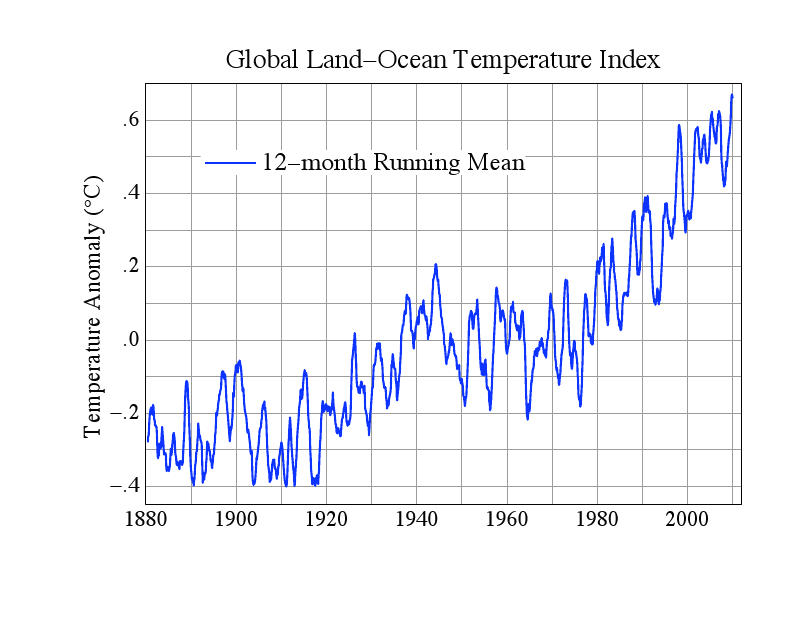
GISS released this graph in July, showing unabated warming since the mid-1970s.
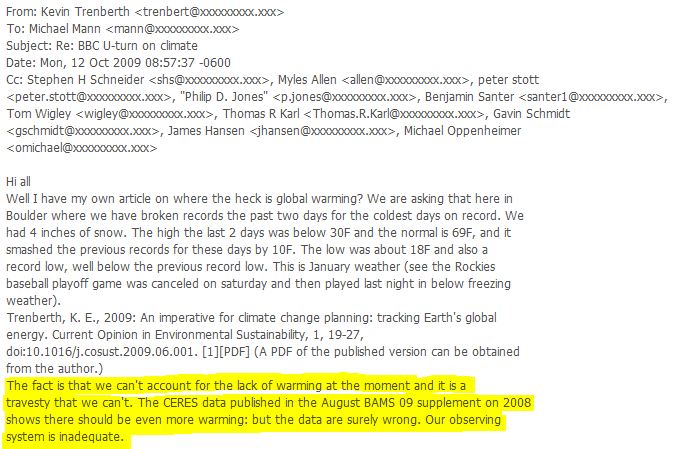
Is the graph consistent with this East Anglia E-Mail?
“The fact is that we can’t account for the lack of warming at the moment and it is a travesty that we can’t. The CERES data published in the August BAMS 09 supplement on 2008 shows there should be even more warming: but the data are surely wrong. Our observing system is inadequate.”


but the data are surely wrong. Our observing system is inadequate
It only became wrong and inadequate when there was no warming. Until then they didn’t say anything.
yes, totally agree with you Amino
http://www.ecmwf.int/publications/cms/get/ecmwfnews/263
reanalysis confirms the warmth.
So does the combination of every land method used
http://www.realclimate.org/index.php/archives/2010/09/warmer-and-warmer/
The problem isn’t that there is no warming. It is that it is less than one would have expected (until 2010 of course) The period from 2005 to 2009 did not see the accumulation of heat they were expecting to in the oceans or air. However 2010 reversed that and is too close to call as to whether even UAH will have it as the warmest (within 0.06)