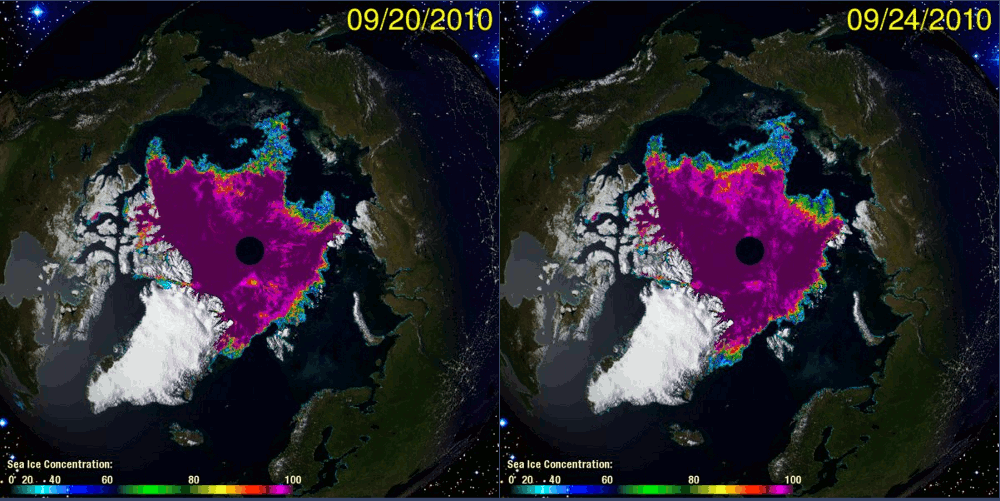
http://arctic.atmos.uiuc.edu/CT/animate.arctic.color.0.html
Over the last few days, 30% concentration Arctic ice extent has increased by about 10% – a very early and rapid freeze for mid-September.
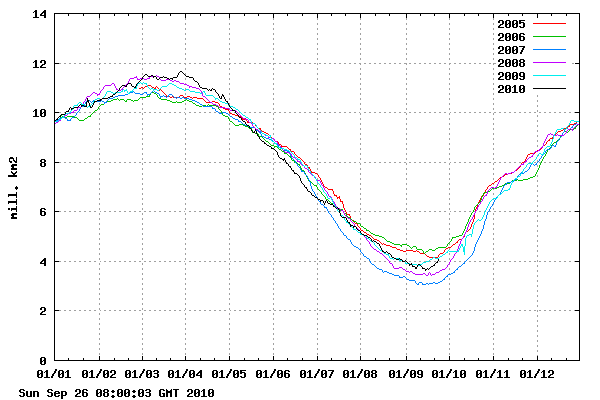
http://ocean.dmi.dk/arctic/icecover.uk.php
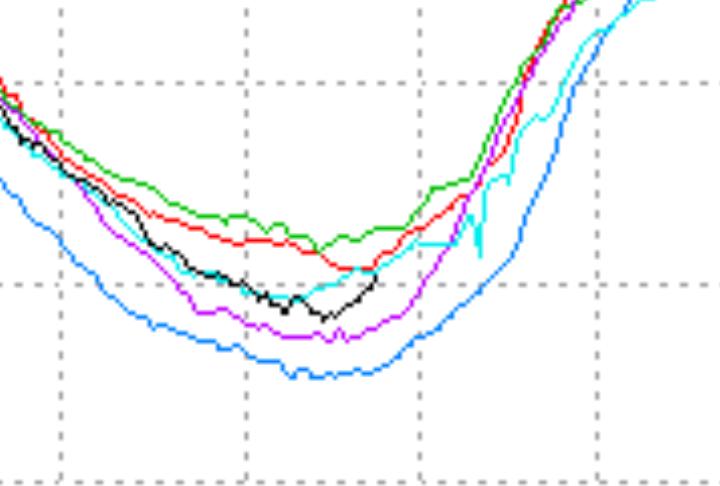
Extent has almost returned to 2009/2005 levels.
So what has caused this rapid rise?
It is mainly due to cold water. Note that the ice (black line) was tracking just below 2005 (red line) until mid-August. Then southerly winds started blowing, pushing the ice edge back and melting some it. Ace the ice melted, it cooled the water.
This left a large region of water just above the freezing point. As soon as temperatures dropped below freezing, the ice refroze very quickly. This is what is known as a negative feedback. The melting ice created conditions which allowed new ice to easily form.
Now that the ice is back to where it “should be” I expect that growth will slow down some – because the region of cold water has been consumed.
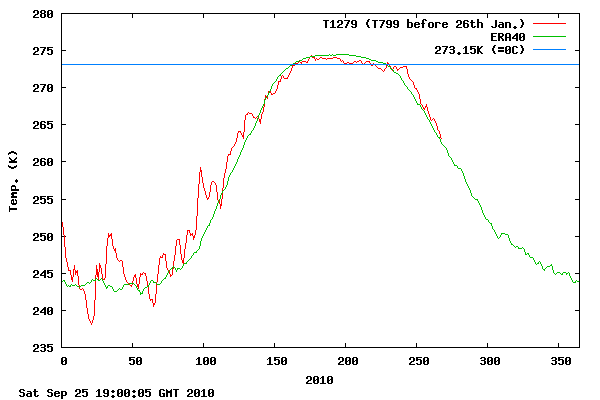
There is another factor though. Temperatures this autumn in the high Arctic have been the coldest since 2004, and are just above the 50 year mean.
http://ocean.dmi.dk/arctic/meant80n.uk.php
Because this is the hottest year ever and the Arctic is the fastest warming place on the planet.


I love your ice updates 🙂
I could be wrong but one of the best indications for a good ice year seem to be the anchors like Ostrov and the Canadian Archipelago. Svarlbard in particular looks like it acts as a gatekeeper from the Arctic. The sooner those links are made or strengthened the better. Normally the ice is still retreating from Svarlbard at this time of year but with the big wedge of ice forming along Greenland’s northeast edge I’m hoping the ice will reconnect sooner than last year. It wasn’t until about mid December before there was a decent connection to the island and the western edge has been largely ice free for a few years.
An early refreeze of the waters of the archipelago would also be a very good sign.
It took me some time to notice that although the graphs of Ice cover in the Northern Hemisphere typically show below average cover for recent years and the equivalent graphs for Southern hemisphere ice cover above average, this coincides with the slightly concentric orbit of the Earth around the Sun which sees 7 July earlier this year the closest point to the Sun and coming up 3% closer in the beginning of Feb. The July date gives the Southern Hemisphere winter a little more chill and the current nearer approach a slighly less winter chill for the North overall. Check out my paper on the science of Climate change at my website http://billpeddie.wordpress.com for more complications.