http://data.giss.nasa.gov/gistemp/graphs/Fig.A2.gif
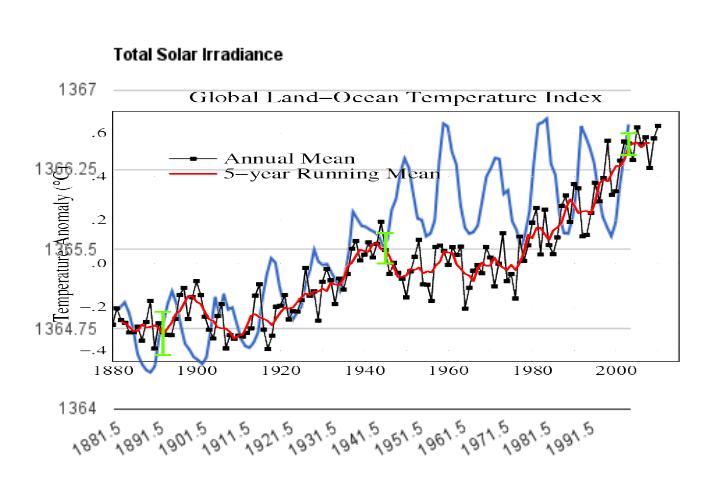
Hansen says that changes in TSI (Total Solar Irradiance) can’t account for temperature rises during the last century, because the increase in TSI was too small and because it has flattened.
At the same time, he argues that small increases in CO2 forcing are having a much larger impact on temperature – due to feedback and accumulated heat in the ocean. His argument is that as long as CO2 forcing is out of equilibrium, the temperature continues to rise.
The problem is, the feedback/accumulated heat argument would apply equally to high levels of TSI. Until ocean temperatures equilibrate, temperatures continue to rise.
His selective use of logic to support a pre-determined result reeks of an agenda.


Other than the extreme cluster of El Ninos from 1940 – 1970’s, looks like a perfect fit to me……………….
lack of coffee….
It was a cluster of “LA NINAS” you know, the cold one…..duh
Steve,
My understanding is the the actual amount of radiation is the important factor.
You overlapping graph could be showing an increase in TSI that is so small in terms of total anergy that it would not be possible to have it cause a significant increase in temperature.
Also from 1960 there appears to be no positive trend at all.
As usual, it all flew right over your head.
Dr Hansen seems only to be able to consider one variable at a time.
Perhaps two would help, like that the AMO & PDO peaked in the early 2000’s just when the solar influence flattened.
My count has 1900-2000 at +0.82 C of which 0.27 C is from the PDO/AMO cycle, 0.4 C is from the total of solar influences, 0.1 C is our friend CO2 (including other GG’s) and 0.05 C is UHI and diesel fumes.
Icebergs and TSI have more underneath than can be seen.