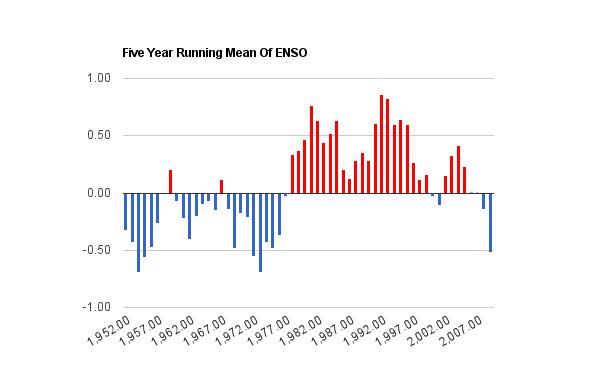
http://www.esrl.noaa.gov/psd/people/klaus.wolter/MEI/table.html
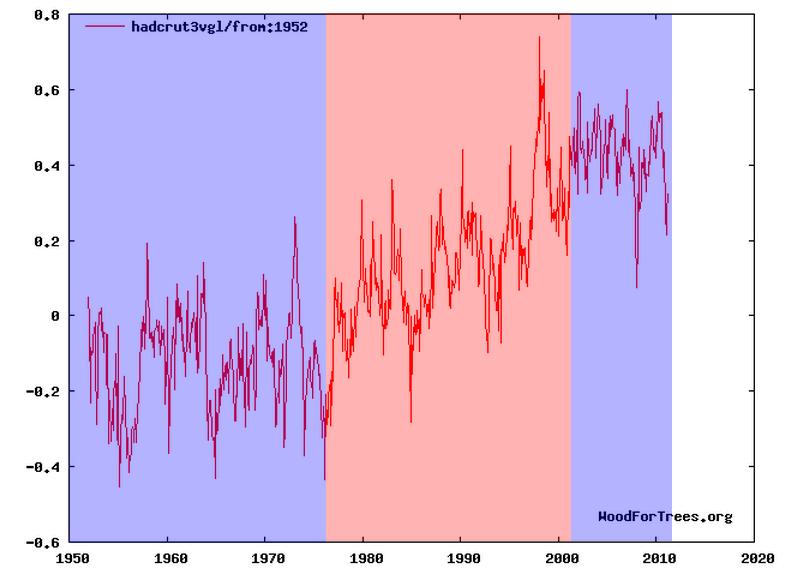
The period from 1977-2000 was dominated by strong El Ninos. It also was a period of warming, surrounded by periods of flat or cooling, which purely coincidentally were ENSO negative.
http://www.woodfortrees.org/plot/hadcrut3vgl/from:1952
Being the good peer-reviewed climate scientists that we are, the obvious explanation is that the 1977-2000 warming is due to CO2. All weather is unequivocally due to CO2. We need billions and billions of dollars to make computer models in order to prove that it is due to CO2.


It’s still only 1/2 a degree….
Thank God we have hysterical bedwetter climate scientists to tell us…
….otherwise no one would have noticed
We should pull the Mauna Loa records for the 1700s and 1800s to see if CO2 was driving the PDO then also.
For thirty years the CO2 has a positive effect and for thirty years it has a negative effect. NOTHING else could explain the phenomena!!!! 😉
Why have we not seen an acceleration in the rate of sea level rise?
Hottest decade
Melting glaciers
Global warming since 1975 😉
Head in sand. 🙁
Well, going by that graph and your logic, the Earth warms during El Nino and stays flat during La Nina. If that’s really the case, we’re gonna get f*cked as the temperature continues to ratchet up. Personally, I’d much rather believe it had something to do with CO2, since then we can do something about it.
Why are you so pessimistic?
lol, I think you’re being overly optimistic if you think you can control the climate.
But Peter, let’s say we could. Let’s say we find the tree of knowledge again and take another bite and we suddenly know all that is necessary to run our climate. Who gets to pick? I mean, sure some places would still be cooler than others, but that’s not all it takes to maintain our climate. There will still have to be floods, and hurricanes and tornadoes and other extreme events. Who gets to pick?
No, we can’t do anything about it, nor should we want to. You might as well start building another tower of Babel.
We went through a long period of record high solar activity last century. HadCRUT shows temperatures declining this century.
lol, yep, its gotta be the CO2.
Here Steve, I like to use this one from time to time.
http://www.woodfortrees.org/plot/hadcrut3vgl/from:1959/scale:75/plot/hadcrut3vgl/from:1959/to:1977/trend/scale:75/plot/hadcrut3vgl/from:1977/to:2001/trend/scale:75/plot/hadcrut3vgl/from:2001/trend/scale:75/plot/esrl-co2/from:1959/offset:-310/plot/esrl-co2/from:1959/to:1977/trend/offset:-310/plot/esrl-co2/from:1977/to:2001/trend/offset:-310/plot/esrl-co2/from:2001/trend/offset:-310