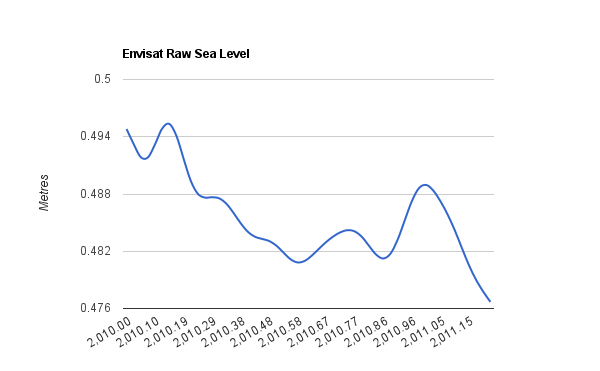
Europe’s Envisat satellite measured a drop in sea level of almost 20 mm since the beginning of 2010, and is now lower than at the start of their record eight years ago.
Meanwhile, back at Hansen’s global warming propaganda factory, they were telling us :
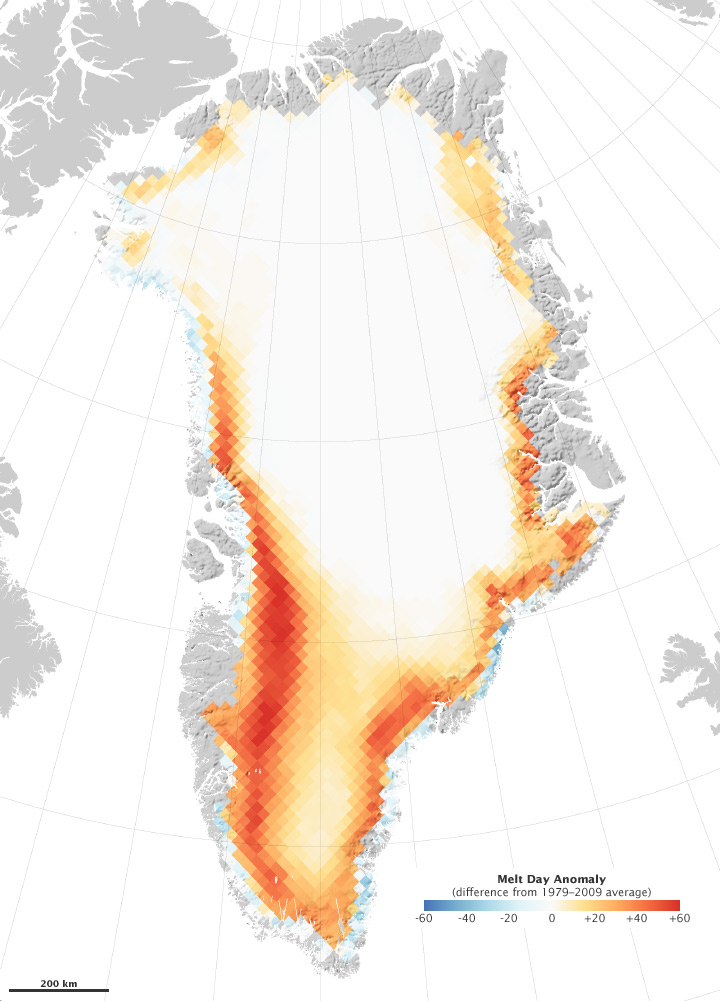
Record Melting in Greenland during 2010
2010 was an exceptional year for Greenland’s ice cap. Melting started early and stretched later in the year than usual. Little snow fell to replenish the losses. By the end of the season, much of southern Greenland had set a new record, with melting that lasted 50 days longer than average.
Hansen also told us :
2010 Is Officially the Hottest Year on Record
Well, it’s a tie actually. The final tallies are in and 2010 is even with 2005 as the warmest year on record. NASA and NOAA independently released their own reports yesterday, confirming the improbable and remarkable statistical tie. NASA’s Goddard Institute for Space Studies explains:
The two years differed by less than 0.018 degrees Fahrenheit. The difference is smaller than the uncertainty in comparing the temperatures of recent years, putting them into a statistical tie.
If Greenland had record melt and the Earth was the hottest it has ever been, why did sea level decline dramatically back to pre-2004 levels? If Greenland were melting at rates never seen before, sea level should be shooting through the roof, not dropping like a rock. Where did all the record meltwater go? Where did all the additional heat in the oceans go?
Either these people are grossly incompetent or they are fabricating data.


I vote for grossly incompetent at fabricating data.
Not only the hottest year but the hottest decade for goodness sake. The glaciers of Europe were also supposed to be melting and discharching all their water. Yet sea level drops! 😉
The missing sea water has been evaporated by the missing hot spot!
Grossly incompetent and fabricating data for me. Not in Gordon Brown’s league though. Our former Prime Minister makes these jokers look like amateurs. He sold 375 tons of our gold at $250/ounce, which has cost us $10,000,000,000. Although a good example of his crass stupidity, it is not even in his top 5 most expensive mistakes, which is heading by the theft of £100-200Bn from all our pensions. An apology from this imbecile is about as likely as Hansen saying that he got it all wrong and CO2 is OK.
exactly……
The funniest thing I see them do is claim record hot year that tied the same temperature in the past…..
Tying an old record means nothing has changed, no global warming, business as usual….
There has to be a “material balance” on both heat and water. If the sea level does not rise (or slightly declines), then “hidden heat” has to be balanced by “lost heat” somewhere else. Likewise, additional (melt) water has to be equaled by water extraction from the ocean somewhere else (i.e. evaporation?).
As to “hottest year”, in a climate of naturally rising temperatures (~ 1 deg C/Century), the baseline should be that general rate of rise – not an arbitrarily fixed temperature level. Thus, the “hottest year” may actually be “cooler than average” – a more accurate interpretation of climate change (and one that fits the current data).
Sam, exactly
The sudden temperature rise from ~1700-1800 can only be explained as natural.
Yet that slope, followed by a flat stair step, is exactly what we are seeing again.
It’s so hot that the oceans are boiling, thus reducing sea level. Maybe I can get a grant to study that phenomena.
Oh moon, in steps forward back, jittery star lit, tarried thee be by floppy minded magnetic magma, and a cometary frockfull of fickles, by these things doth fate be wrought and science be blind.
That’s the raw data – you’ll have to wait for the adjusted numbers which will, one suspects, invert the sign and get the “correct” answer.
…or they are fabricating data.
You mean like this:
One important change in these releases is that we are now
adding a correction of 0.3 mm/year due to Glacial Isostatic
Adjustment (GIA), so you may notice that the rate of sea
level rise is now 0.3 mm/year higher than earlier releases.
This is a correction to account for the fact that the global
ocean basins are getting slightly larger over time as mantle
material moves from under the oceans into previously glaciated
regions on land. Simply subtract 0.3 mm/year if you prefer
to not include the GIA correction.
http://sealevel.colorado.edu/content/new-web-site-new-sea-level-release
The big problem I see is that some of the satellites (like Envisat) show much lower rates, and they choose to ignore this discrepancy.