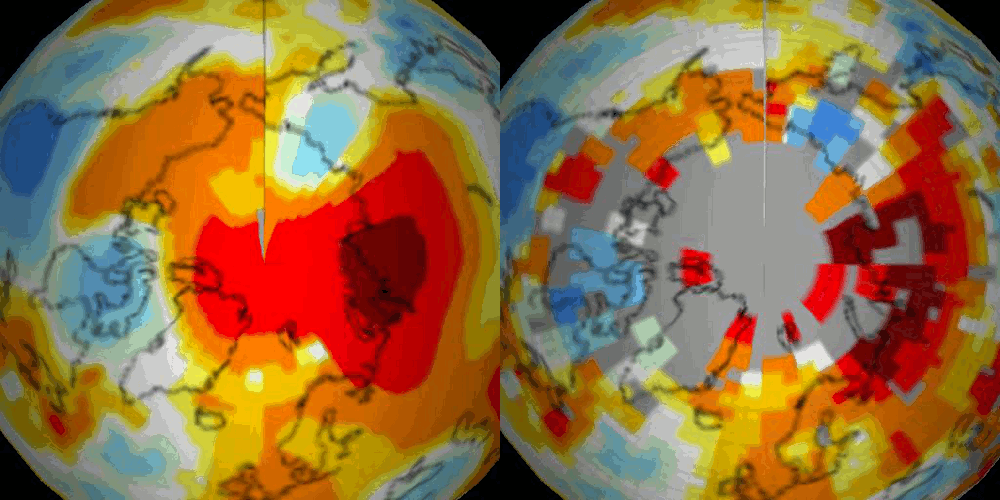
GISS extrapolated that the entire region north of 80N was more than 2C above the 1958-2002 average in May, despite the fact that they have essentially no data there.
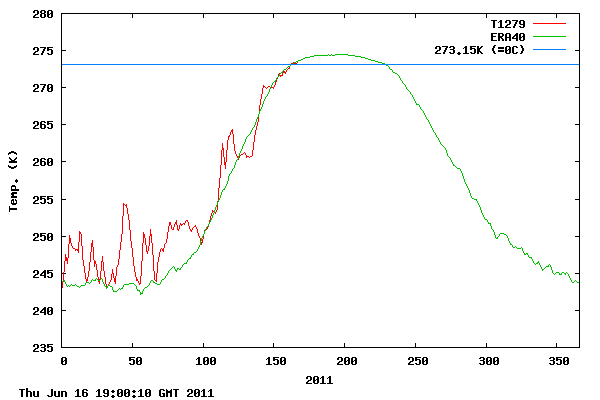
DMI actually has data north of 80N, and they showed May as below the 1958-2002 average.
http://ocean.dmi.dk/arctic/meant80n.uk.php
GISS fabricates big numbers in the Arctic, which has the effect of disproportionately dragging the global temperature upwards. Even so, they still can’t get temperatures up to scenario C.


OT, but what’s the deal with CU’s Sea Level Research Group?
http://www.foxnews.com/scitech/2011/06/17/research-center-under-fire-for-adjusted-sea-level-data/
This is on Drudgereport right now.
It doesn’t make any sense to attempt to make an isostatic adjustment to satellite sea level data. The mass of the earth is fixed. When one place goes up, another has to go down.
what Steve said……………………….LOL
Someone inserted a tube into the middle of the Earth and is blowing into it, causing the land to expand..
Oh wait.. That would cause the seas to expand, too.. Back to my alarmist thinking drawing board..
“It doesn’t make any sense…”
Only in old-fashioned science. Everything is unprecedented now. We must escape the archaic bonds of logic and reason to push forward into the brave new world.
That incredible heat wave around the North Pole didn’t make sense either if you are stuck in that old thinking. And yet there it is, from NASA. Just more proof of the new paradigm.
Mike, they are
They are adding because ‘land’ is supposed to be rising……
……all based on not having any way of knowing what ‘land’ did before
The adjustment just happens to put them right where they should be, and would not be without it…………
to prove global moronic warming………
Satellite data doesn’t measure relative to land.
I know, I was using the map to describe a point to look at…..
…..in particular Alaska and eastern Siberia
….all they needed was 2 degrees, and found it by fudging
wrong post place………..
eastern siberia goes from dark blue to light blue
the tip of alaska goes from yellow to orange
middle siberia goes from red to dark red
the dark blue in hudson bay, goes two shades lighter to light blue
……all warmer
Steve are those two at the same time?
What’s obvious is like middle Siberia, it starts out dark red to light red going toward the Arctic circle. Which means it’s getting back to normal to closer you get. Yet, it’s adjusted to dark red and the red extends all the way. Which is not following the trend…………
If those aren’t the same date…………………………nevermind LOL
May, 2011
Your observation is accurate. The blue never “extrapolates” out of its neighborhood, but the red goes on forever. What a bunch of crooks.
They may have overdosed on Senna:
http://altmedicine.about.com/od/completeazindex/a/senna.htm
A little goes a long way. Of course GIGO rules!
We must act NOW to keep the thawing Arctic from belching up megadoses of evil MEHTANE! Which will make Earth uninhabitable! We are all going to DIE!
“GISS fabricates big numbers in the Arctic, which has the effect of disproportionately dragging the global temperature upwards. Even so, they still can’t get temperatures up to scenario C.”
Give them time, Hansen and his drones are still working on it.
Speaking of extrapolation………
Drop cold temperature stations, keep warm ones, voilà, you’ve got global warming!
http://www.youtube.com/watch?v=wvQKxWz3LJc
Who is the speaker – I’ve been trying to determine this by reference to the Heartland website? It’s good stuff ….
How to create warming by using the anomaly trick
part 1
http://www.youtube.com/watch?v=_kmp3vUJhzI
How to create warming by using the anomaly trick
part 2
http://www.youtube.com/watch?v=Dfew9lgzz5o
Steve,
It’s my impression that DMI also estimates temps above 80N using “model grid points.” Below is their description of how they calculate the daily mean data from their site, which sounds like extrapolation:
“The daily mean temperature of the Arctic area north of the 80th northern parallel is estimated from the average of the 00z and 12z analysis for all model grid points inside that area. The ERA40 reanalysis data set from ECMWF, has been applied to calculate daily mean temperatures for the period from 1958 to 2002, from 2002 to 2006 data from the global NWP model T511 is used and from 2006 to present the T799 model data are used.
The ERA40 reanalysis data, has been applied to calculation of daily climate values that are plotted along with the daily analysis values in all plots. The data used to determine climate values is the full ERA40 data set, from 1958 to 2002.”
The Montana Supreme court has just refused to hear a case intended to hold humans accountable for climate change. They ruled that the case had no merit because the evidence for man’s attribution was weak and culpability for damages could not be established. Somehow I don’t think Hansen’s red and hot pink charts will pass muster in convincing any court that even though no thermometers exist where those huge gaps are, the court should take Hansen’s word for it that it’s really heating up there.