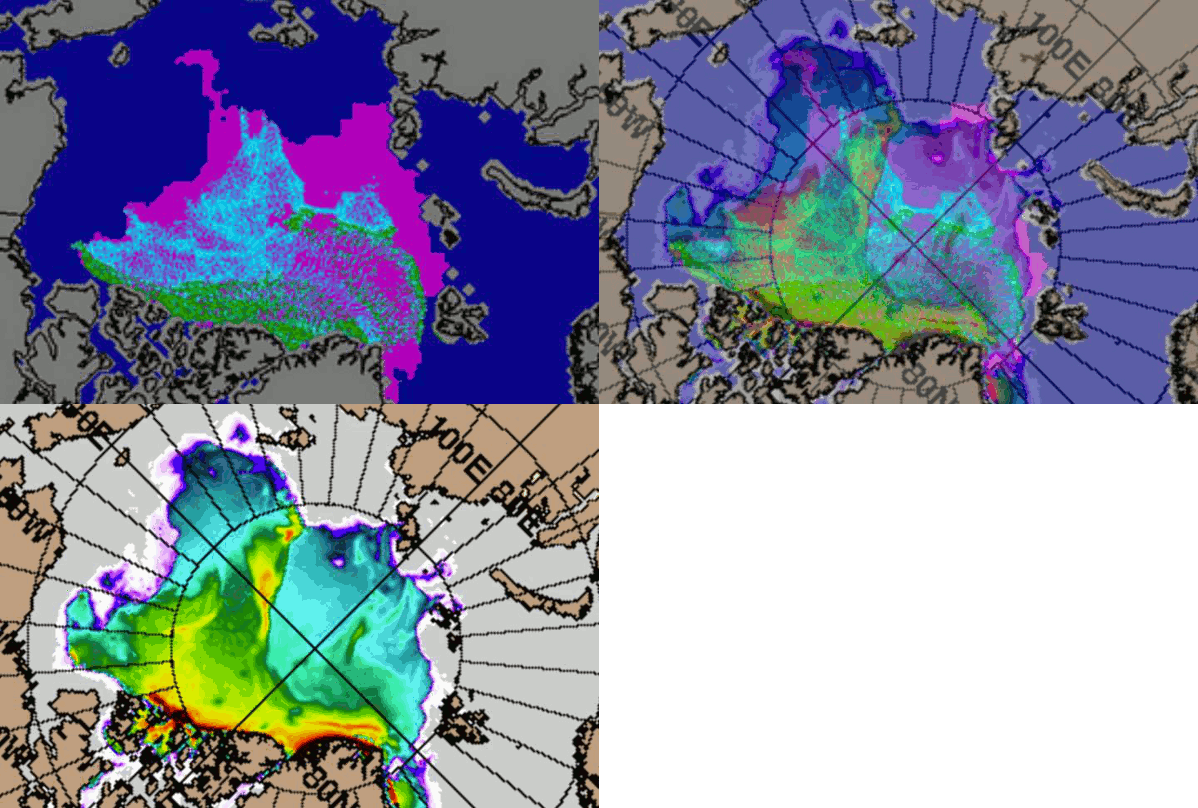
The animation above moves between last year’s NSIDC September ice age map and next week’s Navy ARC map. The NSIDC map (pink, turquoise and green) shows MYI (multi-year ice) as dark green. Most of the yellow and green in the Navy map is MYI.
It appears that there will be a large increase in the amount of MYI relative to last September, as I forecast during the spring.


Yeh, but its rotten MYI and we’ll have less MYI than before 2007. lol.
All this talk of MYI is hurting my ears…
http://www.youtube.com/watch?v=Wy51CTN6AfE
Steve, I don’t believe you can compare maps like that. It’s not only the dark green that is MYI in the NSIDC map, so is the light blue (second year ice). If you compare that to the thicker, non-turquoise ice of the ACNSF map, it looks like there is already less multiyear ice now than there was last year, 4 weeks later.
Question: If 2011 turns out to have a lower extent, area and volume number than 2010, how can there be more MYI? I can’t seem to wrap my mind around that one, but I’m sure you can.
NSIDC defines MYI as greater than two years old. The turquioise is 1-2 years old and is not considered to be MYI
Ah yes, I see what you mean. I guess the point I was trying to make is that the shape that remains when you take away the pink (FYI) in the NSIDC ice age map looks quite a bit smaller than the shape that remains when you take away the cyan (which I would guess is FYI) in the ACNFS map.
I think it all depends how much of the yellow and green in the ACNFS map will be counted as multiyear ice and how much as second-year ice. We’ll know when NSIDC shows a new ice age map come October.
But again: I don’t see how MYI can increase in any meaningful way over 2010 if this year’s minimum extent and area are below that of 2010. We’ll have to wait and see how that pans out too.
I expect that MYI will increase by at least 100% over last September.
Let’s wait and see, Steve. You also had a few posts on how well 2011 was tracking 2006, blotting out all the other trend lines. Not to mention your months of heralding the recovery over at WUWT, to be quietly shuffled off by Watts when 2010 extent kept going further past your initial prediction.
In the end the only thing that matters is how thick that MYI is in relation to the pre-2005 era.
The Arctic is clearly recovering. The ice is much thicker and older than 2008.
I expect that MYI will increase by at least 100% over last September
What percentage of the remaining ice pack was MYI last September ?
The Arctic is clearly recovering. The ice is much thicker and older than 2008.
Thanks for a good laugh !
What is it you are laughing about?
I’m happy for you that you are so certain, Steven. I’m not so sure.
Did you hear Mark Serreze forecasting an ice free pole this year? Why not?
No, but in a twist of irony Steve Goddard’s favorite ice thickness model apparently did.
Since late April/early May 2011, PIPS 2.0 has developed an unrealistic opening in the North Pole region. On 22 May 2011, PIPS 2.0 stopped running because of a numerical instability.
http://www7320.nrlssc.navy.mil/pips2/
Wow. What a completely pointless comment.