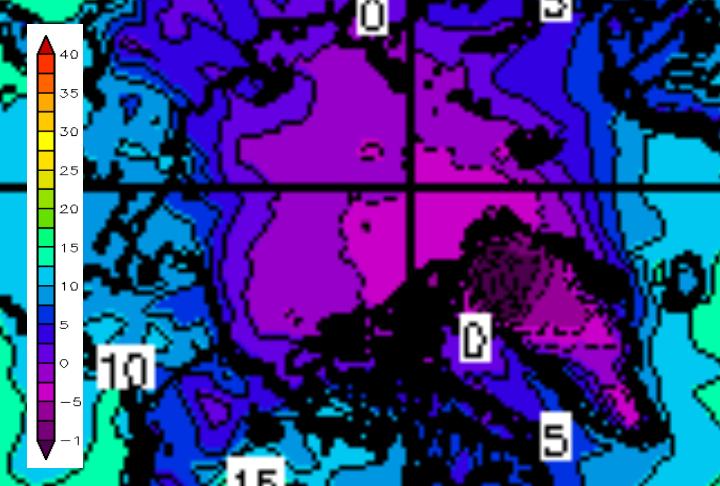
The Arctic is getting rather chilly, with temperatures over the entire ice pack ranging from 0 to minus 15ºC.
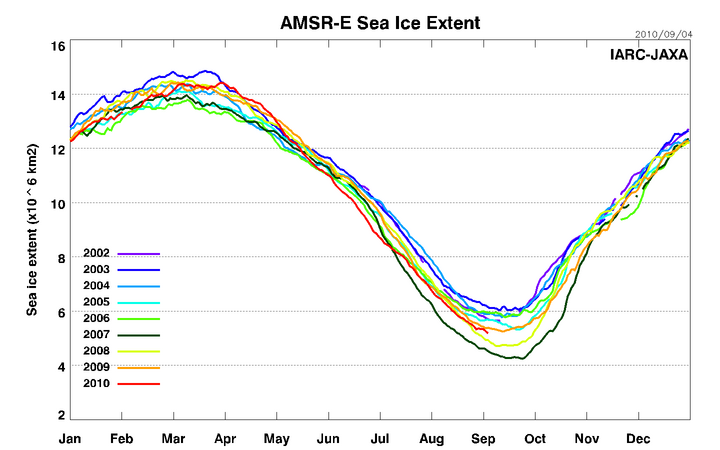
Over the last few days, a lot of the remaining low concentration ice in the East Siberian Sea has melted out. You can see that represented in the downwards blip below.
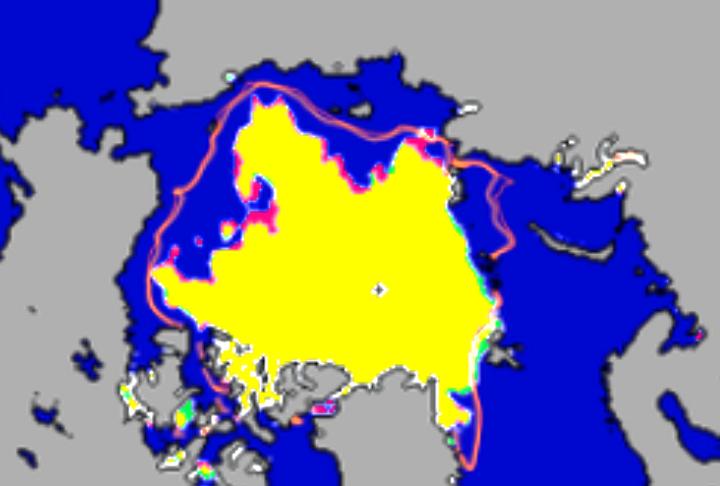
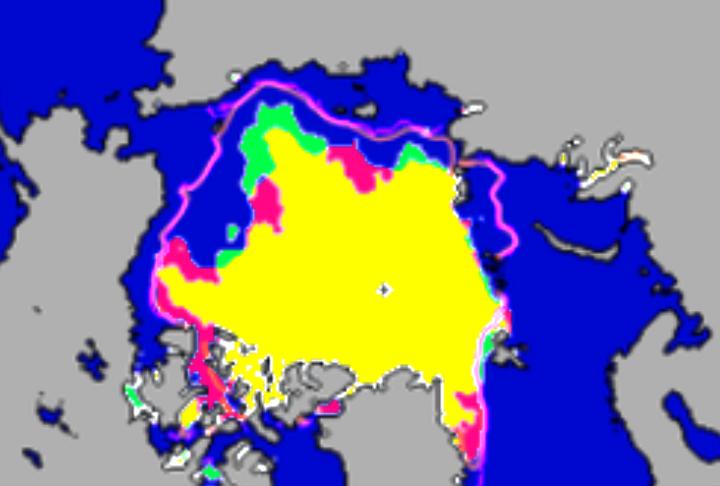
The modified NSIDC image below shows changes in the ice over the last week. Losses are shown in red, and gains in green.
The modified NSIDC image below shows changes since 2007.
NSIDC typically bottoms out during the first week in September. This makes sense given the widespread cold, and new ice should start forming any day now. We will see that represented in the area graphs a little before it shows up in the extent graphs. First places to freeze should be areas of lower concentration ice near the pole.

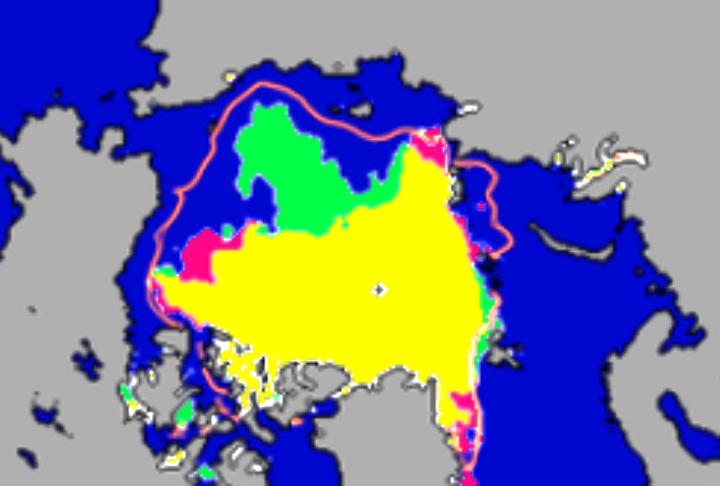
The modified NSIDC image below shows changes in the ice relative to September, 2009
2009 had thinner ice in the East Siberian and Beaufort Seas, but experienced much less wind during the summer. Note that 2009 had a lot more ice in the Northwest Passage.
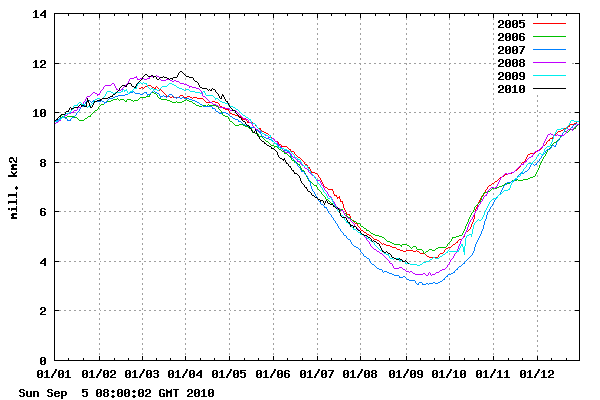
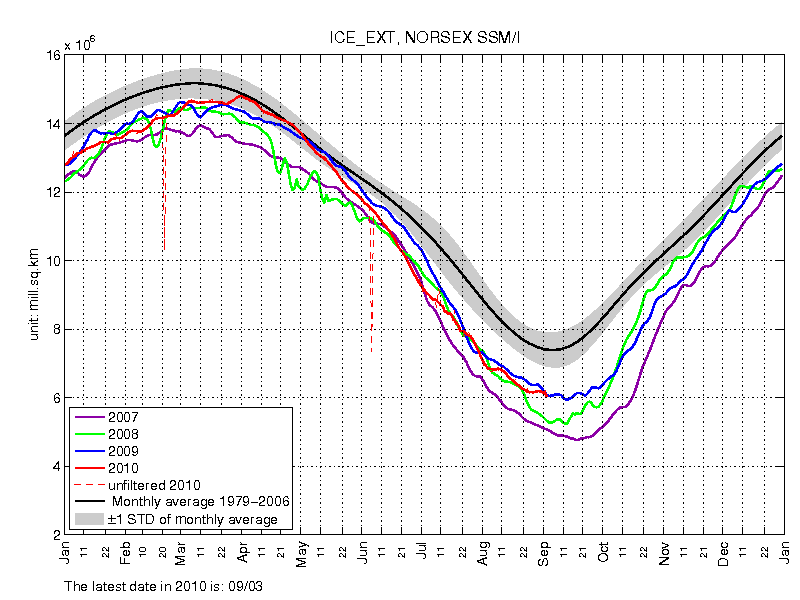
DMI and Norsex show 2010 and 2009 even, while NSIDC and JAXA show 2010 below 2009.
The target below shows current forecast rankings. The bullseye represents current JAXA extent (5,190,313 km²) and each ring represents 100,000 km² error. Looks like it is going to be very close between my August SEARCH forecast (5.1) and NSIDC’s (5.0.)
http://www.arcus.org/files/search/sea-ice-outlook/2010/09/images/summary/siofig1.jpg

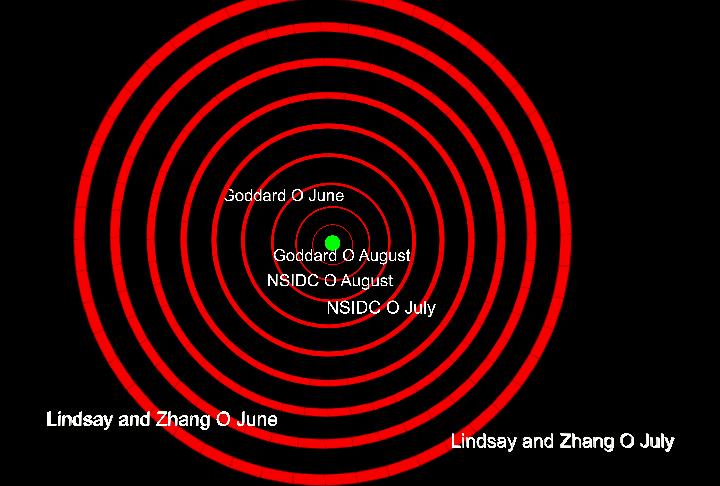
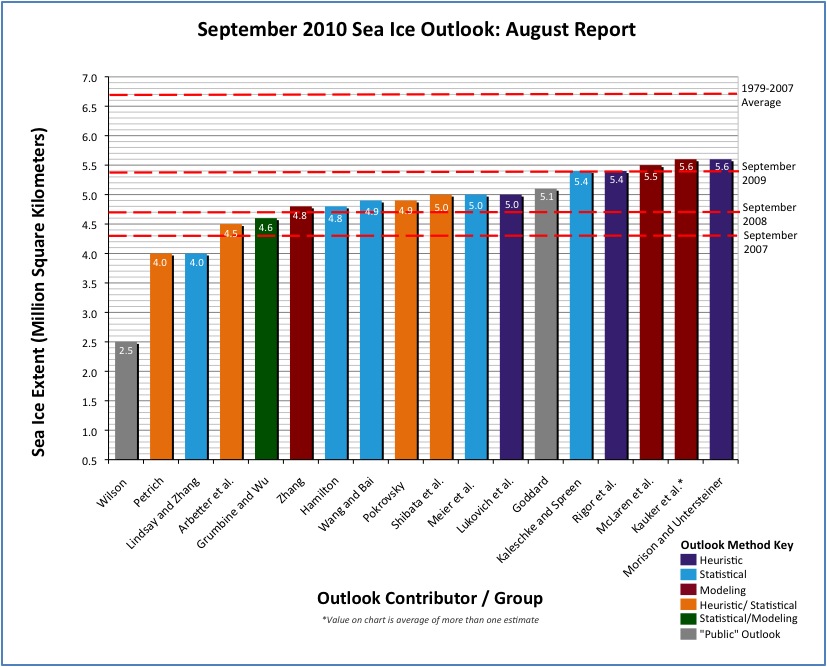

Who is interested in forecasts from August (of the same year)? Anybody can get near this bullseye in August. Let us not forget that Goddard as well as Stroeve prognosticated 5.5 in June, which turns out to be a bit on the high side. Was it not Bastardi who made a forecast already last year? How close did he get one year before the event?
http://wattsupwiththat.com/2010/05/24/the-sea-ice-monster-its-a-scaly-thing/#comment-395961
You can see the complete range of August forecasts here :
http://www.arcus.org/files/search/sea-ice-outlook/2010/09/images/summary/siofig1.jpg
Always appreciate all the work you do on these frequent updates on the condition of the ice. Of course, the bottom line will be that this year’s melt is greater than last year, so the soothsayers of gloom and doom will be pressing that message for all it’s worth until September 2011 (compensating for the discomfort they felt at the late date of max extent, perhaps). Looking forward to a state of the multi-year ice report.
Sorry OT but I thought you might be interested the deniers Ice Island has slipped out into the Nares Strait.
http://ocean.dmi.dk/arctic/images/MODIS/Kennedy/20100831AQUA.jpg
That is some god forsaken looking country up there.
The SEARCH project is based on the NSIDC data which is currently 4.97 so it appears you’re out of the reckoning.
Where do you get the NSIDC numbers from?
I explicitly specified in my SEARCH submission that my forecast was based on JAXA. If what you are saying is correct, they should have notified me so I could adjust the numbers.
Here is the complete text of my SEARCH submission
Thanks Phil for filling us in on NSIDC. But has already been examined in the past, NSIDC has data that is different than other agencies. JAXA does not show what NSIDC shows. It stands to reason that you would chose the NSIDC to highlight and not any other. This shows your bias. We all know that Mark Surreze is the head of NSIDC. Since an alarmist of the first order was assigned to the helm there it shows everyone the NSIDC is a government agency and not an unbiased science agency. ‘Global warming’ is coloring everything that happens there.
If, in fact, the NSIDC is only presenting the data as it really is then the government did itself a huge disfavor by promoting Mark Surreze, an open alarmist, a man only known because of alarmism, to run it. But, since it was he that was promoted one can see the bias.
Amino, it might do you some good to read papers published by Mark Serreze as it seems you do not know anything about his work except for some media reports. You also don’t seem to understand how sea ice concentration and extent are derived from passive microwave observations, the different algorithms used and their sensitivities, methods for filtering out weather and land contamination, etc. Finally you don’t seem to understand what NSIDC is, which is one of the NASA DAACs. BTW…our data is available for anyone to do their own analysis (including the raw data), the algorithms are also available, so there is 100% transparency in the sea ice fields. Feel free to do your own analysis to test how “biased” you think our data are.
Joe Bastardi European Blog
Joe Bastardi’s Europe Column
POSTED: 7:42 p.m. September 2, 2010
(…)
In the spirit of transparency, I was wrong about global temp dropping in August
The global temp DID NOT FALL in August as I had predicted it too. Whether this a delay of my idea, or denial will be settled in the spring. In the meantime the .51 was slightly cooler than the .52 in August of 1998 and means this year still trails the warmest satellite year on record, 1998
Duly noted and logged, I was wrong on that.
Full post: http://www.accuweather.com/ukie/bastardi-europe-blog.asp
Regards
Normally September is the month when temperatures drop after an El Nino.
Steven, I hope it’s okay for me to post this off-topic question. I have noticed that sea ice concentration under what NISDC calls the ‘pole hole’ has recently fallen below 100%. This poses an interesting dilemma. IJIS for instance assumes there to be 100% ice, so their total extent number might be overestimated. I’ve written a blog post on it and I think I have managed to get a clear and recent satellite image composition that shows the area in question.
Now I know that you use pixel counting for various research purposes. Could you give me a tip on which software to use etc., so I might try to assess what the area number is (and perhaps after that extent) for the North Hole?
Neven,
I believe that NSIDC also assumes 100% concentration under the pole hole, because they don’t really have any way to measure it accurately. I wrote a related article about this a few months ago.
http://wattsupwiththat.com/2010/04/09/an-error-in-the-pole-hole-assumption/
I use some proprietary software I wrote for a start up I founded a few years ago in Berkshire. It hasn’t gone commercial yet, though I keep planning on doing that!
Yeah, now I remember. You mentioned that software not too long ago. And I also vaguely remember that piece about the pole hole on WUWT (am rereading it now).
Cheers,
Neven
Steven, in retrospect (now that I know more about the North Hole myself) I dare say that was one of the best pieces I’ve seen you write for WUWT.
ps I think the image is too vague to really pinpoint the number with which IJIS extent is overestimated, but it’s probably not more than 50K. Area is another matter, could be 100K max.
Make that 0K extent. I’ve gridded the image and there are no 25×25 pixel squares that have less than 15% ice coverage, I think.
stevengoddard says:
September 5, 2010 at 7:14 pm
Where do you get the NSIDC numbers from?
Julienne Stroeve
I explicitly specified in my SEARCH submission that my forecast was based on JAXA. If what you are saying is correct, they should have notified me so I could adjust the numbers.
It’s been the case in previous years (for example the 2009 value shown on the graph is 5.36, the NSIDC value), they should have told you.
I wonder why doesn’t NSIDC publish their daily numbers like JAXA does? They also don’t archive ice images on a regular basis.
I don’t know, I mainly follow CT and JAXA which both provide digital data.
Does JAXA make their area data available?
Steve, the ice images are archived on a regular basis here: ftp://sidads.colorado.edu/DATASETS/seaice/polar-stereo/nasateam/near-real-time/browse/north/
The daily values you can get by writing NSIDC USO and asking for them, while the archived, highest quality daily extents are provided here: ftp://sidads.colorado.edu/DATASETS/seaice/polar-stereo/trends-climatologies/ice-extent/nasateam/).
While we use near-real-time data for the sea ice news and analysis web site, we always suggest that users of the data wait to use the sea ice fields that we derive from the RSS antenna temperatures rather than the near-real-time ones since the RSS data have undergone higher quality control.
Nope (unfortunately).
Amino says:
September 5, 2010 at 8:02 pm
Thanks Phil for filling us in on NSIDC. But has already been examined in the past, NSIDC has data that is different than other agencies. JAXA does not show what NSIDC shows. It stands to reason that you would chose the NSIDC to highlight and not any other. This shows your bias.
You appear to have missed the point, SEARCH chose NSIDC not me.
you chose both
ok, so what was your point? that were trying to show him up?
I find these arctic ice graphs fascinating, as we all do, I believe. However, I never seem to see similar graphical representation of antarctic ice, although there are often articles about it. If such graphs are available, I am sure everyone would be intrigued. Have I just missed them?
It is interesting that no one talking about global warming wants to point out how Antarctic ice is in step with Arctic ice. They could easily make a case for a relation between North Pole and South Pole ice. It is a fascinating relation. While the Arctic had gone down in mass until 2007 Antarctic ice had gone up. A perfect balance in nature that is normal.
But I know there will be rationale why that is from ‘global warming’ and co2 and not from natural variations in the earth. After all, if you wanted to, you could say everything is global warming and make it sound reasonable to some people.
Others though sit back and wonder when is this side show going to end. I suppose as long as billions are pumped into it it’s going to go on.
Amino, there are several papers that discuss the factors contributing to increased Antarctic ice extent. If you are interested in reading them, I can give you the references.