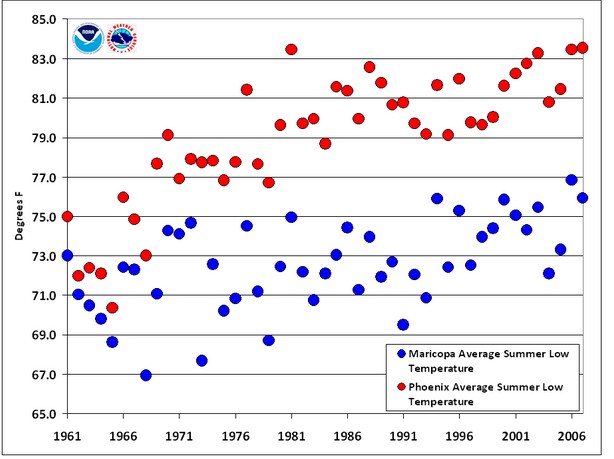
It is well known that nighttime surface temperatures have risen over the last century. This is primarily due to the Urban Heat Island effect. Asphalt, heaters, air conditioners, irrigation – they all keep nighttime temperatures up.
NOAA did a study showing that Phoenix is now 7-13 degrees warmer at night than nearby rural regions.
National Weather Service – NWS Phoenix
I measured the same thing on my bicycle in Fort Collins two days ago. You don’t need a large city to create UHI – just one paved road.
Asphalt Heat Islands | Real Science
Rather than accepting the painfully obvious facts about UHI, alarmists instead try to blame the nighttime warming on imaginary feedback from CO2.


So true. I live in southeast Phoenix Arizona a densely urbanized area close to a rural area. I mount an external temperature logger on my car and right about sundown drive from my house to the open desert to the south (as a matter of fact toward Maricopa) and then back north to the city. I have consistently measured around 7 degrees F cooler temperature in the open desert compared to the city. Others have done it too who live in North Phoenix – it just isn’t that hard to grasp; the asphalt, buildings, concrete, structures – they get hot during the daytime and in the summer get exceptionally hot from the intense radiant solar heating – the open spaces, not so much.
Stuart Gaffin talks about the urban heat island effect and Columbia University’s green roof research station. on his youtube video uploaded 3 years ago…
http://www.youtube. com/watch?v=yB8xcSwrvhY
Yes, basically an advert for green roofs but still shows the facts.
There are many similar videos on youtube.
In UK London Gatwick airport has had a rural weather station (Charlwood) about 1km away from it for the last few years. Here is a comparison of the “minimum” temperatures (the maximum temperatures are almost the same).
Year Tmin Tmin (Celsius)
GAT CHA Diff
2004 6.4 1.8 4.6
2005 – – –
2006 7.4 3 4.4
2007 6.8 3.1 3.7
2008 6.6 1.9 4.7
2009 6.6 2.4 4.2
2010 5.1 4.6 0.5
2011 7.1 6.2 0.9