Sea level rise brings to mind the threat of coastal flooding from menacing storm surges, with growing risks to shore-based infrastructure — but a new study indicates there’s another sea level rise-related threat that has so far slipped under the radar.
According to the study, as sea level rises, so will groundwater levels, and since underground infrastructure — including sewer pipes and utility equipment — was built with historical groundwater levels in mind, this could lead to expensive headaches for coastal communities.
A projection for what New Haven would look like after three feet of sea level rise. Blue areas are at or below three feet in elevation. Click on the image for a larger version, or explore the interactive maps from Climate Central’s Surging Seas project.
The study, by the U.S. Geological Survey (USGS) and Yale University, looks at the threat to New Haven, CT, Yale’s home city. Sea level rise may indeed raise groundwater levels significantly underneath the city, according to the study, leading to problems not just with pipes and pumps and buried cables but also with the arch-nemesis of many New England homeowners — basement flooding.“Scenarios for the resulting higher groundwater levels have the potential to inundate underground infrastructure in lowlying coastal cities,” the study states.
Since the 1960s, sea level has risen by about 0.38 feet, at a rate of about .008 feet per year, at Bridgeport, CT, about 20 miles southwest of New Haven. Because the land in this area is slowly sinking at the same time the sea is rising, the amount of local sea level rise is expected to be greater here than in some other parts of the country. According to the study, some climate change scenarios show that sea level may rise by nearly three feet above current levels by 2080.
Why Groundwater is Another Sea Level Rise Concern | Climate Central
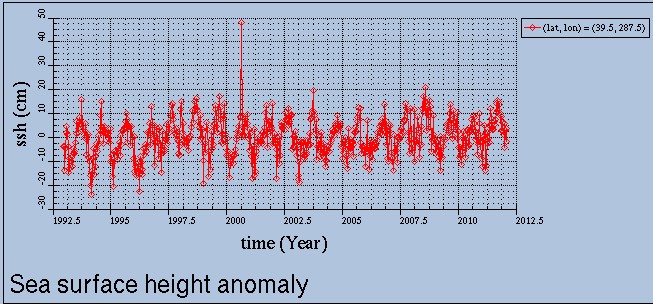
Satellites show almost no sea level rise around New Haven over the last 15 years- see the CU graph below. The perceived sea level rise is due to subsidence caused by groundwater pumping. If the groundwater was replaced, the land would stop sinking and the perceived sea level rise would stop. He has his thinking cap on exactly backwards.
All of the other crap in this article is mindless speculation. The IPCC forecasts only 18-59 cm of sea level rise this century. Freedman is pulling alarmist numbers and logic out from where the sun never shines, and not checking his facts.
h/t to Marc Morano


Abstract here:
http://pubs.usgs.gov/of/2012/1025/
Main report here:
http://pubs.usgs.gov/of/2012/1025/pdf/ofr2012-1025_report_508.pdf
Curiously, the report says: “Since the 1960s, sea level has risen at Bridgeport, Connecticut, about 0.38 ft (115 mm), at a rate of 0.008 ft (2.56 mm ± 0.58 mm) per year”, yet there are no specific references given to this data point.
I was going to start trawling through the references, but I think it’d be a waste of time anyway. A number of them are dated over 10 years ago.
Some of them in the pdf are very old, e.g. Brown, J.S., 1928, Ground water in the New Haven area, Connecticut: U.S. Geological Survey Water-Supply Paper 540, 206 p.
But there is this – National Oceanic and Atmospheric Administration, 2011, Web page accessed November 28, 2011, at http://tidesandcurrents.
noaa.gov/sltrends/sltrends_station.shtml?stnid=8461490
Which if you correct the web address of the errant spaces goes here –
http://tidesandcurrents.noaa.gov/sltrends/sltrends_station.shtml?stnid=8461490
which is for New London, Connecticut. It seems to give the same sort of figures as the report’s text. There is however a link to “NEW! Updated Mean Sea Level Trends” where they have jiggle the figure statistically to allow “…the mean trend may change from year to year, there is no statistically significant difference between the calculated trends if their 95% confidence intervals overlap. Therefore, the most recent calculated trend is not necessarily more accurate than the previous trends; it is merely a little more precise. If several recent years have anomalously high or low water levels, the values may actually move slightly away from the true long-term linear trend.
The main effect of including a few more years of data is to narrow the 95% confidence intervals.”
Update the web address a little to get 8467150 Bridgeport, Connecticut at
http://tidesandcurrents.noaa.gov/sltrends/sltrends_station.shtml?stnid=8467150
Tide gauges can’t differentiate between sea level rise and land subsidence.
Yes, but I don’t think anyone told them.
But, Tide gauges are “Always” planted on solid rock! 😉
There is an interesting ‘war’ going on between the empirical scientists who specialise in sea level rise and the alarmist scientists who extrapolate from their computer models. One side happens to think the other side are full of shit… Will be interesting to see how the IPPC 5th assessment report portrays this ‘debate’.
There can be no debate because one side is full of shit and they do not have science on their side, only fairy tales.
Most densely populated areas manage their groundwater levels to the upside via pumping stations. An example might be Berlin which is built on a former swamp area. Their high use of groundwater makes it necessary to mothball three of nine pumping stations previously used to keep groundwater from rising too far, which throws considerable cost issues and flow management problems in the lap of their cash-strapped city government.
Andrew is clueless because he gets his “Science” from clueless wannabees.
miked1947: What exactly characterizes a “clueless wannabe”, so I can avoid such people in the future? Would the USGS be characterized as such, since that’s where this study came from in the first place…
Andrew,
Are you seriously interested in exploring this issue? It is trivial to show from satellite sea level data and GPS data that the vast majority of apparent sea level rise on the east coast is due to subsidence.
http://stevengoddard.wordpress.com/2012/05/05/sea-level-isnt-rising-manhattan-is-sinking/