The 1970 cherry picking scam has become a centerpiece of the global warming fraud.
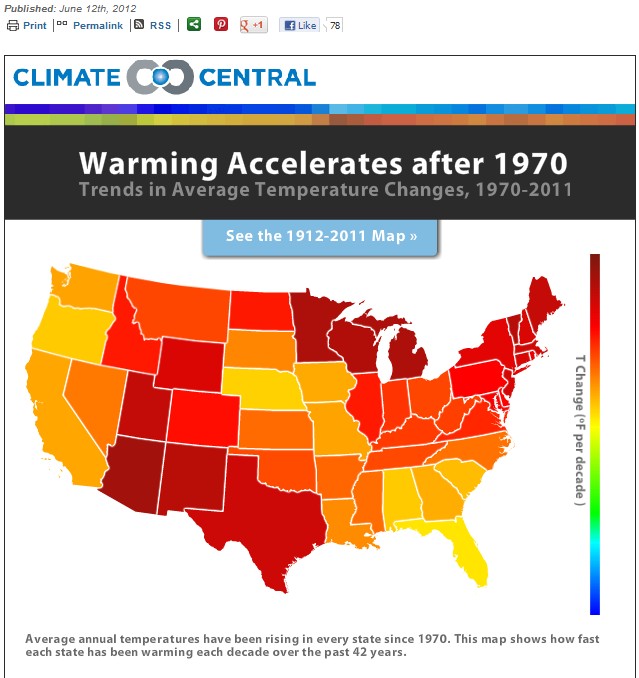
The Heat is On: U.S. Temperature Trends | Climate Central
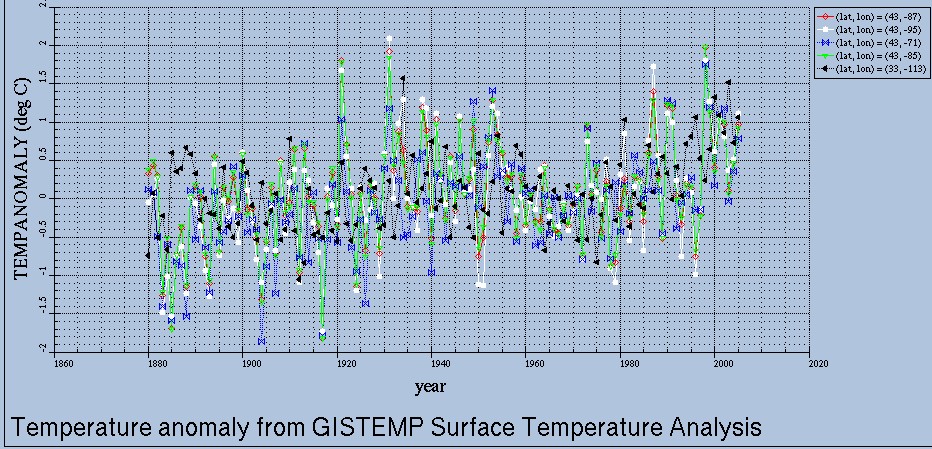
The graph below plots Hansen’s 2006 temperatures for the five states which have warmed the fastest (in the map above) since 1970 – Arizona, Minnesota, Wisconsin, Michigan and Vermont. The 1970s was one of the coldest decades in US history. By starting in 1970, Climate Central is intentionally defrauding their readers. Had they started in 1950, there would be almost no warming shown.
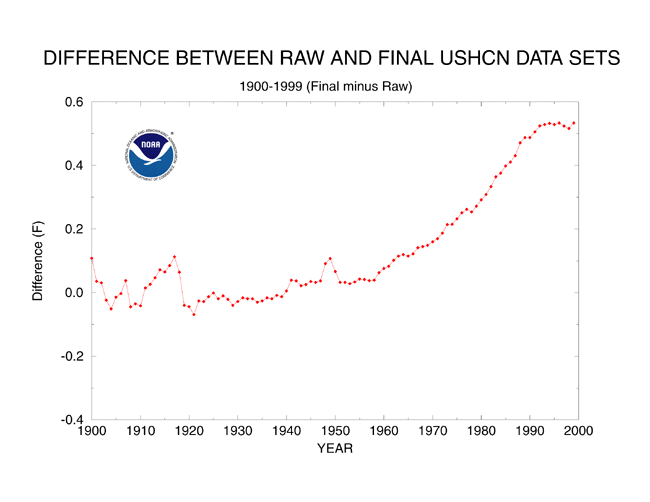
Also important to remember that all recent temperatures are jacked up by 0.5F. What a bunch of crooks!
ts.ushcn_anom25_diffs_urb-raw_pg.gif (650×502)
Bottom line is there has been little or no long term warming in the US.


Yes, the alarmists love to hide the incredibly hot 1930s and the modern “Little Ice Age” starting in the late 50’s and continuing until about 1979.
Just a small sample of temperatures from the summer of 1936. It is very rare for temps in the modern era to come within 10 degrees of these.
Norfolk, Nebraska 116
Peoria, Illinois 113
Rockford, Illinois 113
Saginaw, Michigan 111
Terre Haute, IN 110
Eau Claire, WI 111
Duluth, Minnesota 106
Toronto, Ontario 106 (three straight days!)
Starting the trend for this in 1970 is like Obama team’s latest talking point starting the job growth trend from the nadir, 27 months ago, during which 4.3 million private sector jobs were “created.” That’s 159K per month, and it takes like 150K per month just to tread water due to population growth. We are not recovering during this recovery.
How many of those 4.3 million jobs are flipping hamburgers for college graduates?
That does not include all the H1b visa holders and illegal immigrants stepping into those jobs instead of Americans.
So, we see flooding in Florida and wild -fires in Colorado. The predicted Two Solar/Earth Year ‘Wet’/Normal Period moves Westward across America in the wake of the One Solar/Earth Year ‘Dry’ Cycle.(Thirty degrees Longitude/month, with the orbit of the Earth’s Magnetic Field.)
In Australia we are seeing the results of this ‘Dry’ Cycle clashing with the Two Solar/Earth Year ‘Wet’/Normal Period already established in the longitudes immediately to the West . (Australia is one of the last countries affected in the orbit of the One Solar/Earth Year ‘Dry’ Cycle, and thus, subject to this clash.) The prevailing ‘Wet’/Normal conditions to the West of Australia are moving East (axial spin) and intensifying the Southern Lows that have been forced South by the encroaching ‘Dry’ Cycle. This is resulting in a Drier and Colder continent, but wild weather for Perth and the South-East coastal fringe.
These ‘Dry’ Cycles were identified and accurately predicted by Alex S. Gaddes in his book ‘Tomorrow’s Weather’ (1990) An updated version of this work (with ‘Dry’ Cycle forecasts to 2055,)is available as a free pdf from [email protected]
It is time the Temperature Arguments were relegated to the same ‘scrap-heap’ as ENSO/La Nina and AGW! The above Cycles make surface temperature predictions a fallacy.
Why hasn’t NASA put up the ‘World View’ Satellite? Surely not for lack of ‘funding’.
You can’t show this graph too often. It sums up the corrupt heart of the CAFW Scam quite clearly.
Amazing, the temps won’t cross state lines…….