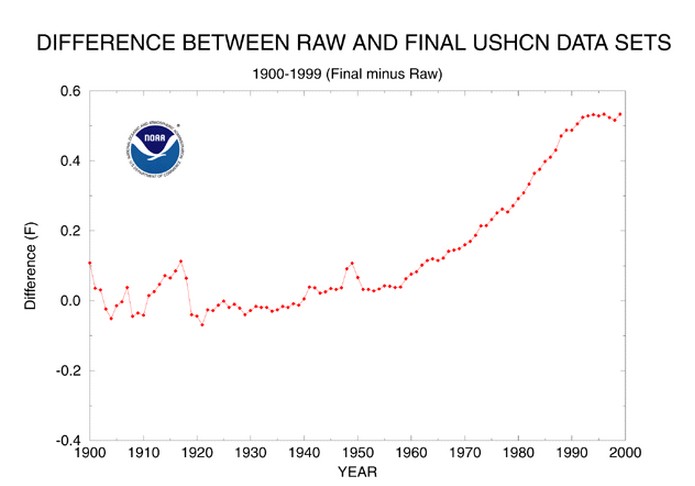
USHCN says that they tamper with data this much
ts.ushcn_anom25_diffs_urb-raw_pg.gif (650×502)
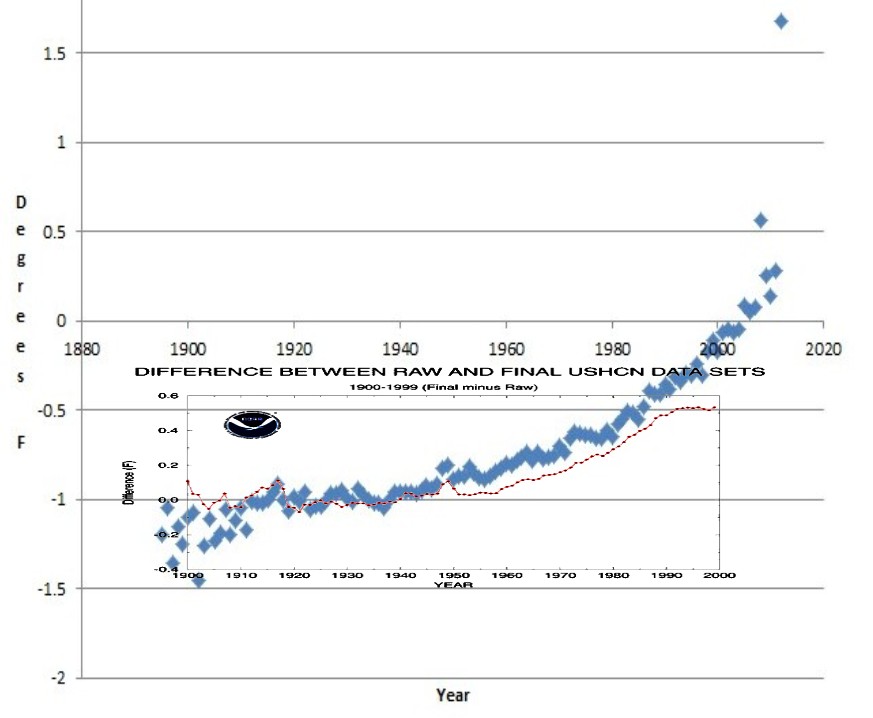
In reality, they do vastly more data tampering than they admit. The graph below overlays the graph above on the current final monthly minus raw.
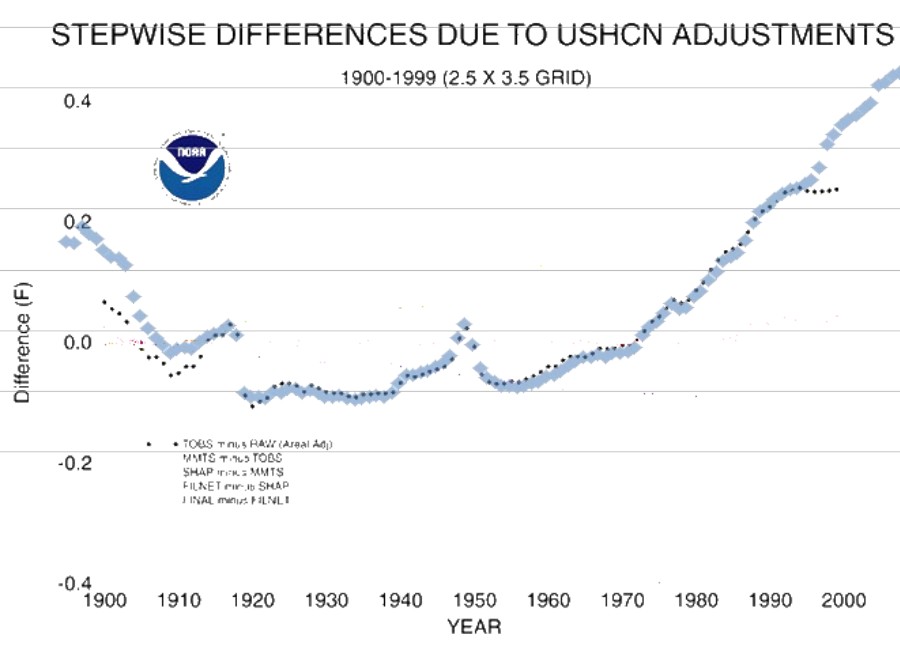
It gets worse though, the final minus daily raw will be even larger than the monthly data. But most disturbing is the TOBS adjustment. According to Menne et al 2009, the TOBS adjustment hasn’t changed from USHCN 1, which showed no increase after 1990. yet now we see continuing TOBS adjustments (blue below) from 1990 to the present.
The 1990s station data hasn’t changed. The algorithm hasn’t changed. Why has the adjustment changed?
None of this makes any sense. They are adding to their adjustments for political reasons, not scientific ones.


@Steve: Check out the temperature adjustments that were made in New Zealand:
http://joannenova.com.au/2012/08/dont-mention-the-peer-review-new-zealands-niwa-bury-the-australian-review/#more-23150
Yep….. they just adjust with impunity.
I was shivvering my nuts off this morning (in Brisbane Australia) but then I made a TOBS adjustment (mentally) and suddenly my finger tips were much warmer.
You’re comparing a graph from ungridded data to a graph from gridded data. That’s the likeliest source of the (minor) discrepancies.
Is gridding another word for cheating?
That is complete BS. The difference between the average F52 and the average raw is the average station adjustment. That adjustment is increasing in USHCN2 after 1990, it didn’t in USHCN1. Do you think the stations are migrating to escape global warming.?
gridding is not cheating but an absolutely necessary adjustment step to transform station data into useful information about temperature over a region.
But you simply can not compare gridded data to ungridded data. That is like comparing night temperature to day temperature or summer to winter or apples to oranges. you could also call it cheating, if you want to do so!