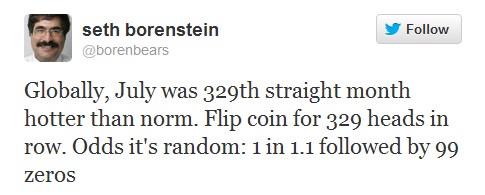
Twitter / borenbears: Globally, July was 329th straight …
NOAA picks a cold period for the baseline, adjusts recent temperatures upwards and fails to account for UHI. The odds of them reporting honest temperatures are zero out of infinity.
Perhaps Seth could explain why half of the lower 48 US states set their all time high temperature record during the 1930s.


Lets see if an honest detailed temperature reconstruction can be put together that is good enough to reference and shows the 1930s to be hotter than today. Or, anyway, we need a best reference for the point that the ’30s were hotter. Lets blow lid off the constant bullshit emanating from these bullshit artists.
Seth B Borenstein…
1979 – 1983… BS in Journalism – Boston University
1975 – 1979… Bexley High School”
I wonder if he will ever put that degree to use?
I believe he is putting his BS degree to good use all the time, that is the problem.
How do you get a bachelor of science in journalism? Or do they really mean a bs degree – I can’t believe they’d be that honest!
Alarmist journalism is to blindly parrot whatever manipulated data they are spoon fed. Even if there were catastrophic warming (which there isn’t) the odds against 329 straight months above normal are astronomical. The fact they are willing to go so far off the deep end tips their hand.
Exactly right, the fact that they make such outrageous claims and assumptions such as this just shows how they follow the 3 I’s of stupidity: insanity, incompetence, and ignorance.
Yeah, The alarmist defined norm.
I’m no climate scientist, but it seems someone needs to tell Seth that the temperatures aren’t spit out randomly. The temps will tend to be cyclical.
Yeah, I believe a series like this is what statisticians refer to as “auto-correlated.”
Seth, what were the odds of all those 1930’s temperatures being over the norm? Or half of the
years after 1950, all with with increasing atmospheric CO2, being below the norm, and far below the 1930’s average? As Justa Joe notes above, it’s the cycles, stupid!
For a science writer, it is odd to see him using the term ‘norm’. Actually he is referring to ‘an’ average, and not ‘the’ average. It is ‘an average’ of temperatures over an incredibly miniscule segment of the Earth’s history.
Stunningly myopic, on that note alone.
wrong agains 30 year means, which are the true reliable ones based on satellites
http://www.drroyspencer.com/latest-global-temperatures/
I’ll trust the satellites over the cherry picked and analog stacked BS they put out any day!
Not this bullshit again. He should read Jeff Master’s retraction.
And of course, sequential monthly temperature anomalies are not uncorrelated with each other, as (fair) coin flips are, so the comparison is completely bogus. Typical innumerate journalist.
It’s very apropos that Seth looks like a latter day Gene Shalit. Although Gene was probably better with numbers.
http://media.screened.com/uploads/0/2361/377491-gene_shalit_large.jpg
http://media.screened.com/uploads/0/2361/377491-gene_shalit_large.jpg
The NCDC dataset uses the 20th century (1901-2000) average as its baseline. Also, an above normal global anomaly is not the same thing as a record U.S. anomaly nor does it require such an anomaly. Nevertheless, July 2012 broke the monthly mean temperature mark previously set in 1936.
Actually, according to the NCDC’s best system, and who would choose to anything but the best, July 2012 broke the July 2012 record with the aid of desktop adjustments. Using the new NOAA/NCDC US Climate Reference Network (114 stations placed in pristine environments by the National Oceanic and Atmospheric Administration (NOAA) in the continental U.S. for the express purpose of detecting the national signal of climate change), the average temperature for July 2012 was 75.5°F, 2.1°F lower than the 77.6°F that NOAA’s old network, including poorly sited stations, produced.
No it didn’t the raw data says that 1901 and 1936 were hotter
Greenland ice cores show that 9,400 of the past 10,000 years were warmer than any of the past 100. The Holocene Climate Optimum of 6,000 years ago (sea levels were higher then), and the Medieval Warm Period (850-1350 AD) were both global and warmer than current warming. In fact, we’re in the coolest of six warming periods since the end of the Ice Age 12,000 years ago. As warm as it has been in this interglacial period, it was much warmer 125,000 years ago during the Eemian interglacial, when sea levels were up to 20 feet higher than now. Today’s warming is “unprecedented” only if you look at global temperatures after 1950.