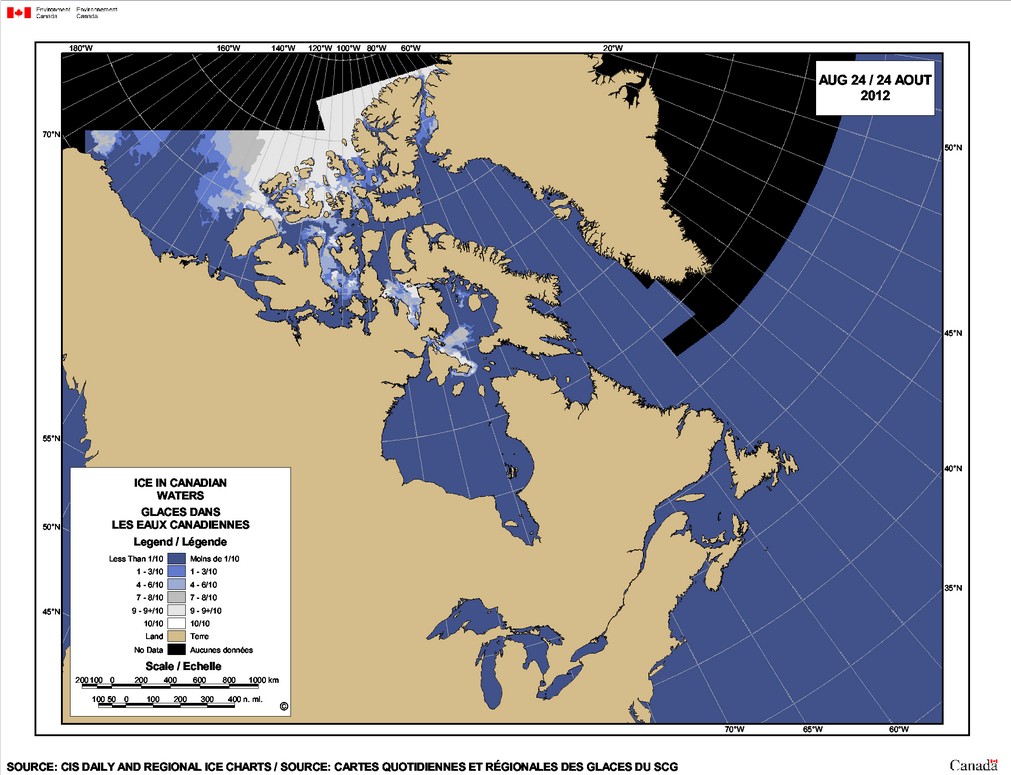
An early winter storm broke the ice in the Chukchi Sea up into chunks of a size which microwave sensors are missing, so the alarmist community goes full stupid over their own defective measurements.
Twitter / climatebrad: Serreze expects a seasonally …
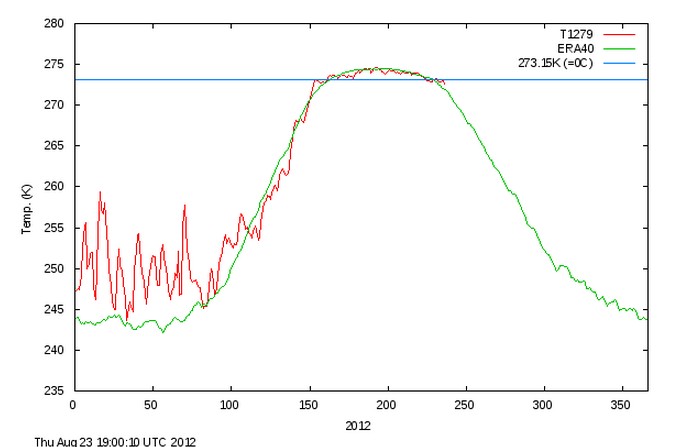
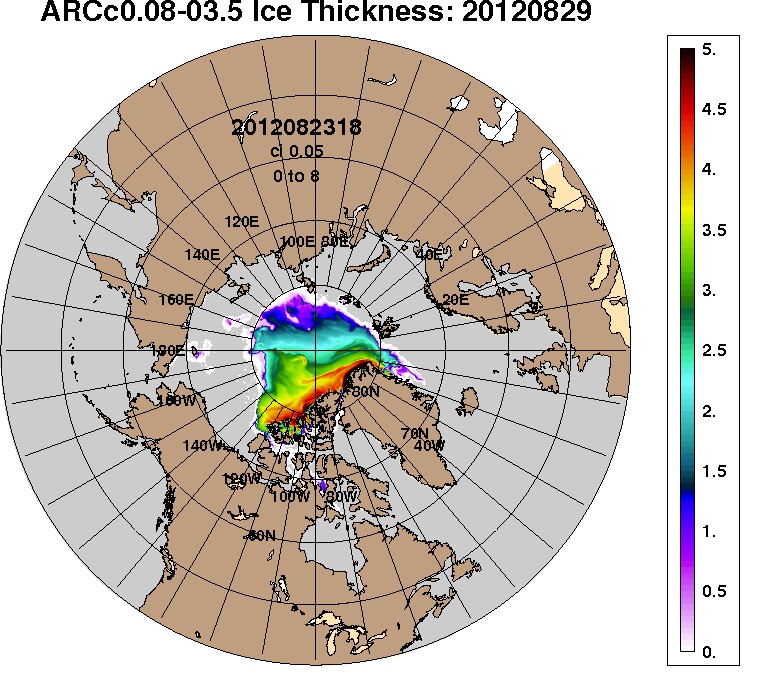
Summer temperatures north of 80N have been running below the long term mean for many years, and the ice there is several metres thick. How could anyone be daft enough to predict an ice-free Arctic?
COI | Centre for Ocean and Ice | Danmarks Meteorologiske Institut
arcticictn_nowcast_anim30d.gif (740×666)
There is plenty of ice up there, but your methodology and thought process is broken, Mark Serreze
Your own web site says that you miss a large percentage of the summer ice.
“NIC charts are produced through the analyses of available in situ, remote sensing, and model data sources. They are generated primarily for mission planning and safety of navigation. NIC charts generally show more ice than do passive microwave derived sea ice concentrations, particularly in the summer when passive microwave algorithms tend to underestimate ice concentration. The record of sea ice concentration from the NIC series is believed to be more accurate than that from passive microwave sensors, especially from the mid-1990s on (see references at the end of this documentation), but it lacks the consistency of some passive microwave time series.”


give him a Kayak and send him out:-)
Mark probably thinks Afghanistan is a gun free zone, because he cannot see then from space.
When I was a Remote Sensing student, my instructors always reminded me of the importance of in situ observations, as they often corrected what we thought we saw from afar.
If he does get sent out in a kayak then he should be required to count all the drowned polar bears also . And he should take a diving suit with him so he can record the thickness of the ice cubes . With good luck maybe he will stray into Russian territory and they will keep him . But they would probably throw him out as they already have enough lunatics of their own.
A quick clarification on the different sources: the quote above refers to concentration, which will affect \”area\” estimates. NSIDC uses \”extent\”, which counts any ice above 15%, so a concentration bias won\’t affect the detection of ice extent except at low concentrations. There is still some ice missed by passive microwave sensors using the extent threshold, but it\’s generally much less than for area. NSIDC and the IMS/MASIE extent estimates generally agree well, with NSIDC being a bit lower. This year is unusual in that there is a lot of very low concentration ice in the Chukchi Sea that passive microwave is not seeing, but IMS/MASIE analysis has been counting as ice. That ice will likely melt completely in the next couple of weeks and the area will open up in IMS/MASIE.
A key point is that IMS/MASIE and other operational sources, such as from NIC, use a variety of data sources that are inconsistent in quantity and quality, as well as subjective human analysis to create maps of ice. A primary purpose of these maps is to support navigation in ice-infested waters. So they tend to be conservative and count even areas sparsely covered with ice as \”ice-covered\”. The passive microwave data is produced by completely automated processing that is consistent over the entire record dating back to 1979. Thus, while absolute estimates of ice cover may be biased, the trends and variability (e.g., comparing records, determining a record low extent) is more accurate than from using operational sources.
Walt Meier
NSIDC
Walt Meier , thank you for your willingness to comment and interact with those of us who question the validity of the statements made by several in the government agencies who appear to be rabid supporters of the agw agenda. The individuals I refer to have brought me to question the accuracy of all of the information being produced by anyone in any of the government agencies as the individuals in question are never questioned as to their behavior nor in any way silenced but instead are permitted to propagate any scare tactic they come up with . In other words , they are making you look bad and bring disrepute to your reputation by the guilt by association accusation . You say there is inconsistency in quantity and quality of some data and that passive microwave misses some ice and then go on to reassure us that we should take your word for the fact that things are as you say they are . Sorry Walt , I am no longer willing to just take someones word for anything no matter how good their intentions .
Thank you John!
Who — exactly — in the government agencies are rabid supporters of AGW and what — exactly — were THEIR statements that led you to believe that their agencies were trumping up scare tactics.
I hope you are joking.
Hi Whatever,
I think that their main problem is, apparently, with Jim Hansen for this sort of thing:
http://www.sciencemag.org/content/213/4511/957
“Potential effects on climate in the 21st century include the creation of drought-prone regions in North America and central Asia as part of a shifting of climatic zones, erosion of the West Antarctic ice sheet with a consequent worldwide rise in sea level, and opening of the fabled Northwest Passage.” As if!
Also, the IPCC claiming that Arctic Sea Ice would be at about 6.5M square miles extent by 2012. As if…
http://www.iup.uni-bremen.de:8084/ssmis/extent_n_running_mean_previous.png
Arctic Sea Ice is in full recovery mode:
http://cruelclimate.net/images/seaice.recovery.arctic.png
The question was directed at johnmcguire. Asking you for specifics, ie. Hanson and the “keep the money coming in” and “worst paper I have ever read” proved to be an exercise of evasions and non-answers.
How come the volume is crashing too then? It’s too bad that CryoSat-2 is up there, one more thing for the denialists to deny 🙂
It is too bad that alarmists continue to make unsupported stupid comments.
Well, having hyoooge Arctic warming with just about everything melting, just as AGW predicted, might contradict denialist dogma. Oh dear.
Must be recess time at school.
Gondo must be geven stoddards little brother playing hooky from kindergarten .
Huge Arctic warming? (Well at least I assume that was what you tried to spell).
Have you looked at the DMI graph?
Sea ice volume tells the real story. The sea ice is not recovering after 2007, but it’s collapsing. Positive feedbacks are proablt already hastening the decline (easy to see in the PIOMAS-graph.
This is the largest environmental change during our lifetimes folks, do you want to blame it on UHI or manipulation of data? Think again.
NSIDC shows increasing multi-year ice since 2008, but feel free to continue repeating the same BS over and over again – until I put you on spam.
CryoSat-2 vs. ICESat comparison shows that the collapse in the PIOMAS is pargely real. Ths is big news, a huge volume of ice has already disappeared, making sudden collapses in the sea ice area possible.
I’ll bet you £50 that there’s less MYI this year than last (as a total amount, of course, not as a percentage)
This is the largest environmental chage in our lifetimes ? How old are you ?
40+
Got bigger changes in mind? What would they be?
change you can believe in . Yes we can
huge new forests, birds love it
http://1.bp.blogspot.com/-QfEtYCcL9Fs/TeoUwvnMXeI/AAAAAAAAAoU/Q9VEMwFM5RY/s1600/Windmills+_+New+Zeland.jpg
they could paint them green, from space that would look nice.
we also have huge natural greening thanks to co2 and not rising temperatures.
http://news.nationalgeographic.com/news/2009/07/090731-green-sahara.html
One of the largest, if not the largest, environmental change in human history would not be an “alarmist” statement.
The only thing that has collapsed is the average Lib IQ
It’s clearly the recovery:
http://cruelclimate.net/images/seaice.recovery.arctic.png
I keep missing Julienne because of timezone problems, so if she is tuning in, I will try again.
She asked me for references about the Greenland icecap being smaller than now in the past. Here’s one, and some other related ones follow.
They all confirm the same basic picture that upto about 4000 years ago the Arctic was much warmer than now, when a gradual Neoglacial advance began, with warmer interludes, until the end of the LIA which was the coldest point since the end of the ice age.
1) Kelly and Long – “The Dimensions of the Greenland Ice Sheet since the Last Glacial Maximum”
t has been suggested that the Greenland Ice Sheet receded tens of kilometers within its present day margins during the early and mid Holocene (e.g., Kelly, 1980 and references therein). This ice sheet recession was likely a response to the warmer temperatures of the Holocene Thermal Maximum (9-5 ka) (e.g., Kaufman et al., 2004), which is registered by Greenland ice cores as ~2.5°C warmer than at present (Dahl-Jensen et al., 1998).
and
. In many locations the ice sheet and mountain glaciers reached their maximum extents since the early Holocene during the Little Ice Age
http://www.pages-igbp.org/products/newsletters/2009-2/Special%20section/science%20highlights/Kelly+Long_2009-2%2860-61%29.pdf
2) C J Caseldine – “The Extent of Some Glaciers in Northern Iceland during the Little Ice Age”
Lichenometric studies from four glaciers in Northern Iceland are used to determine the dates of their Little Ice Age maxima. In all cases these date to the last half of the 19th C and probably marked the maximum Neoglacial extent of the glaciers
http://www.jstor.org/discover/10.2307/633535?uid=3738032&uid=2&uid=4&sid=21101000675053
3) Vinther et al – “Holocene of the Greenland Ice Sheet”
our new temperature history reveals a pronounced Holocene climatic optimum in Greenland
http://www.nature.com/nature/journal/v461/n7262/full/nature08355.html
4) Levac et al – “Sea Surface Conditions in Northernmost Baffin Bay during the Holocene”
From ca. 6400 to ca. 3600 14C yr BP, transfer functions indicate warmer conditions than at present, with SST in August fluctuating up to 5.5°C. After 3600 14C yr BP, the dinocyst record suggests a trend of decreasing temperature toward modern values, marked by recurrent cooling events.
http://onlinelibrary.wiley.com/doi/10.1002/jqs.614/abstract
5) Jorgen Steffensen states
1)Temperatures in Greenland were about 1.5 C warmer 1000 years ago than now.
2) It was perhaps 2.5 C warmer 4000 years ago.
3) The period around 1875, at the lowest point of the Little Ice Age, marked the coldest point in the last 10,000 years.
4) Other evidence from elsewhere in the Northern Hemisphere confirms this picture.
http://vimeo.com/14366077
6) Ribeiro et al find
Presently, the Baffin Bay southern sea-ice boundary extends from Disko Island to the southwest, towards Canada. This would imply that prior to AD 1250 this boundary was more northerly and gradually moved towards the vicinity of the core site until after AD 1500 (Little Ice Age), when it was positioned south of the core site.
http://notalotofpeopleknowthat.wordpress.com/2012/01/21/little-ice-age-coldest-period-in-the-last-7000-years-in-greenland/
Wow , Paul Homewood does his homework , thank you .
Paul, that’s some excellent bit of research. Have you been able to map some of this?
An ice free Arctic – how cute! Check out the Enviroment Canada web site for the northernmost weather station in Canada – Alert NU (82.3N). Some quick statistics for those who don’t want to go there and see for themselves – 2011 first day of melting on a consistent basis was June 12. 2012 June 10th. Tmean for July 2011 2.9C, July 2012 4.3C (ranking 21st in the last 63 July’s for Tmean, hardly “unprecedented”), July average since 1958 3.6C, 1971 – 2000 “normal” 3.3C. Days where the Tmax exceeds 0C (ie. melting can occur) 2007 – 85, 2011 – 91, 2012 – 80. Today at 1PM temperature is -1C. The summer freeze has started early this year. Average Tmax > 0C in September is 3 days. Normal annual Tmean -18C, December Tmean has not exceeded -20C since records began. Tmean normals are <-20C from November through April. No Tmax records for any month have been set this century, the Tmax record was set in 1956 (remember the submarine USS Skate surfaced at the North Pole in open water in 1958).
Folks, ice can't melt, no matter how salty it is, when Tmax is <0C on a consistent basis. When Tmean is colder than -20C for fully 6 months every year, it is impossible to be ice free. Yes, impossible.
The Chukchi Sea is a red herring, it's 69N (in other words, pretty far south). Today at Point Hope AK (68 20N) it is 7C and raining. Of course ice melts at 7C. For comparison, Norway stretches up to 71N and Churchill was shipping supplies to the Russians around Norway into Archangel Russia throughout WWII.
I digress. An ice free Arctic would require a change in temperature in the north of about 18 to 20C, on average, which isn't predicted in even the most ridiculous modelling by the CAGW croud.
Can we at least debate something with a realistic chance of happening on this forum?
Given that ice melts at or below 0 C, Tmax on the surface won’t go above 0 C until the ice melts.
Say you get a warm front coming through during the summer, and there’s a mix of ice and water up there. The air is 5 C, the heat transfers, and now the ice + water + air are all 0 C, but there’s less ice. Another warm front means more melting, but still, the temperature afterwards will be 0 C. This’ll keep up until the ice is all gone.
All the excess heat brought in by the warm front will go into melting ice, before it can go into increasing the temperature.
In other words: What’s the temperature in a well-mixed glass with 80% water and 20% slushy ice? Answer: 0 C.
And what about with 80% ice and 20% water? Same answer. Both cases are 0 C.
In other words, you are speculating about things you know very little about.
It is below freezing for 270 days a year at the North Pole and the ice piles up metres thick towards the Canadian coast, with an average summer temperature just barely above freezing.
Wind, it isn’t melt which is happening to the arctic ice. And, there’s very little heat transfer downward from the air. Wind, currents, upwellings, and circulatory oscillations move the ice out to warmer seas, then it melts.
Steven, those points are fine. They don’t really address what I said.
Suyts, my understanding is that melting mostly occurs via the mechanisms you gave, while the addition of snow or ice occurs via surface freezing + snowfall. Whatever the mechanism for freezing/thawing, though, it’s clear that temperatures won’t get above freezing in the areas where there are ice, as long as there is ice. So saying “the summer temperatures haven’t gone above freezing, so we can’t have an ice-free Arctic” is just prima facie wrong.
Sure, if the mechanism is just “refreeze each year, then get pushed out to warmer waters”, it may not be possible to get an ice-free Arctic, even if the ice does keep decreasing in thickness. But, if AGW is actually creating polar warming further south, it means warmer air masses getting further north as well as a shorter freeze season. Likewise, thinner ice is more easily pushed into the warmer waters.
Wind, if the ‘slushy ice’ in your glass happens to be at -2C and the water at +0.1C, then there will not be melting, until the ice warms up to +.00001C. But the water has to cool off to give up its heat. Maybe it freezes instead?
One further thing I would like to comment on that Julienne mentioned when she said.
Hi Paul, a little more information that may be of interest to you…between 1961 and 1990, Greenland was thought to be in relative balance, with an annual accumulation of about 700 Gt per year, balanced by roughly 220 Gt per year lost through runoff (Ettema et al 2009) and another 480 Gt per year through solid ice discharge (Rignot et al, 2008). Since that time, the mass loss has accelerated
The period 1965-1986 is recognised by the Iceland Met Office as an exceptionally cold period, compared to the decades before. The cold, known as the Sea Ice Years, was so severe that it had a disastrous effect on their economy with soaring unemployment rates and a 50% currency devaluation.
It would hardly be surprising that there would be a pause in melting then. Is there any reason to suppose that what we are seeing now is just part of a longer term trend starting in the late 19thC, when the evidence shows this to be the coldest time in the Arctic probably for 10000 years?
As ever I would like to thanks Julienne on spending the time to interact with us all.
Paul
How could anyone be daft enough to predict an ice-free Arctic?
Easy – if you’re daft enough to believe that GCMs can predict climate. Any systematic errors (there are many, they can’t predict cloud cover, a key factor) are magnified n-fold over even just a few years. The authors of AR3 were smart enough to realise that climate can’t be predicted with any accuracy, if at all.
Connection to reality isn’t even a factor in these predictions. It’s just being able to say you’re the head man at NSIDC that convinces people—as you can see in some of the comments here and on other blogs.
Eppur si fluve.
Pay no attention to the North Pole webcam.
That blue stuff in the foreground is just antifreeze.
What they are is puddles on top of the ice. It is not open water.
You thought it was open water?
Here’s the upside: just two years ago the babbling trolls were claiming ice-free by 2020 (2022 at the latest, maybe as early as 2016). Now it’s 2032. So, it’s retreating by 6 years every year. At this rate, they’ll be claiming a FOR REAL THIS TIME ICE-FREE ARTIC[sic] BY 2250 in just 38 years.
Who is more daft, those making the prediction or the ones believing it?
If, say, Arctic SIE had increased this year, you would be crowing about the ice being in recovery, blah blah etc. In fact, weren’t you in February telling everyone that Arctic ice was at or above normal?
You need to just take your lumps. Clearly you only care about data when you think it makes you case — otherwise you dismiss it. You’ve built a perfect coccoon for yourself — you can never be proven wrong…..
So you believe the Arctic is heading to being “ice free’?
You did see the title of this post? You are off topic.
Yes, the Arctic will likely continue to melt, since greenhouse warming will only continue.
Ice melts when it gets warmer — and basic physics says the lower atmosphere must get warmer if we continue to emit more CO2 than the oceans and land can absorb. All indications are that we will continue to do so.
Only the earth has been cooling since 1998, and only there still is no scientific evidence that show manmade co2 controls climate.
But go on believing the guy that works at NSIDC. Some people are swayed by appeal to authority.
The first is false — GISS’s 15-yr surface trend is 0.07 +/- 0.04 C/decade. Since March 1998 it shows warming of 0.22 +/- 0.12 F (both uncertainties at the 95% confidence level).
Your second claim is, of course, very false, as has been known for at least 100 years. Your intentional ignorance impresses no one.
Well, I got to hand it to you, you brought out GISTemp—James Hansen, the environmental activist, hi data set. But you’ll say, “No, it’s ‘NASA’ “.
Why don’t you mention Al Gore next?
“Your second claim is, of course, very false, as has been known for at least 100 years. Your intentional ignorance impresses no one.”
Ah, yeah, 100 years. LOL!
I didn’t know who I was exchanging comments with. I have to go now.
Sure — you, who lacks the simple courage to sign your name to your opinions, knows better than thousands of scientists who have devoted their lives to understanding climate. I’m sure you can’t even understand their papers.
That makes you a joke.
Must be exciting to have all scientists agree with you, David.
Hey , I just saw the David Appell . Quick get his autograph for your collection of nuts who believe a trace gas composing 0.038 percent of the atmosphere controls the climate .
He was a hit and run. Forget the autograph, did you get the license plate?
I’m wondering if sthelensoregon is David Appell? I know some global warming believers use more than one name to give the appearance of bigger numbers of global warming believers than there really is. They’ve been known to exchange comments with themselves.
Both sthelensoregon and David Appell disappeared at the same time. Yeah, probably both the same person. That’s like cheating at solitaire.
So David, manmade co2 controls climate? Is that what your ‘papers’ say?
Hellooooooooo David. Are you going to come out and play? I’d like to slap your silly beliefs around for a while.
All bark no bite David?
Bueller……. Bueller……. Bueller……..
I’ve waited an hour. You didn’t say a thing. Who’s the coward!
Incredible. I have read through all this garbage, and the only thing I can conclude is. Who gives a rats ass if the Arctic is ice free?. What the hell difference does it make? Will the globe stop rotating? Will the moon crash into the Pacific? WTF? Who gives a shit? An ice free Arctic doesn’t mean squat. I couldn’t care any less. And attempting to predict such a thing is even dumber.
You know, Carnegie Mellon University once invented the most powerful microscope on the planet. Said to be able to see right down to the very atomic level. One could actually see individual atoms. If I were using that microscope right now, I still could not see my concern of an ice free Arctic …. pppfffftttt….
“An ice free Arctic doesn’t mean squat” Wow! Ever heard the phrase “Cause and effect?”
When the Arctic ice was expanding rapidly in the 1960’s and 70’s, it caused huge problems with drought areas expanding disastrously in Africa and Asia, whilst other areas experienced an increase in extreme weather incl floods, heatwaves and cold.
The reality is that climate is changing all the time, regardless of what we do. It is a nonsense to suggest that slightly less ice in the Arctic will automatically have a harmful effect globally.