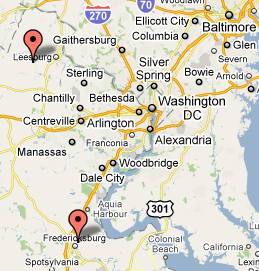
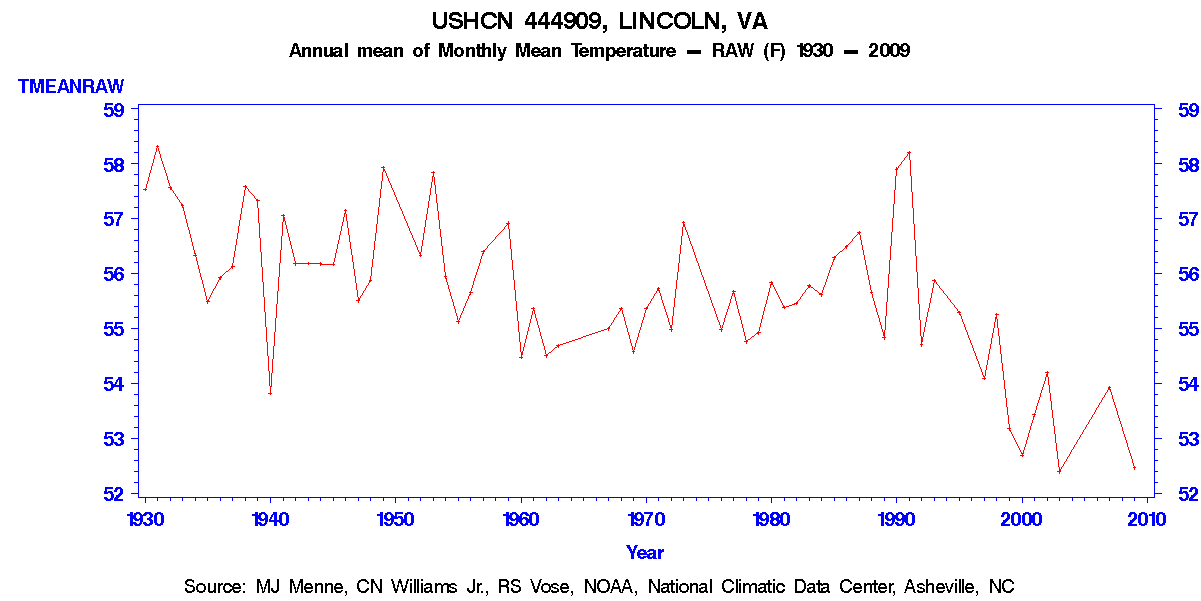
As if the Lincoln, Virginia USHCN comedy wasn’t enough fun, this story gets even better. The next closest station to Washington D.C. is at Fredericksburg, Virginia, about 50 km to the south.
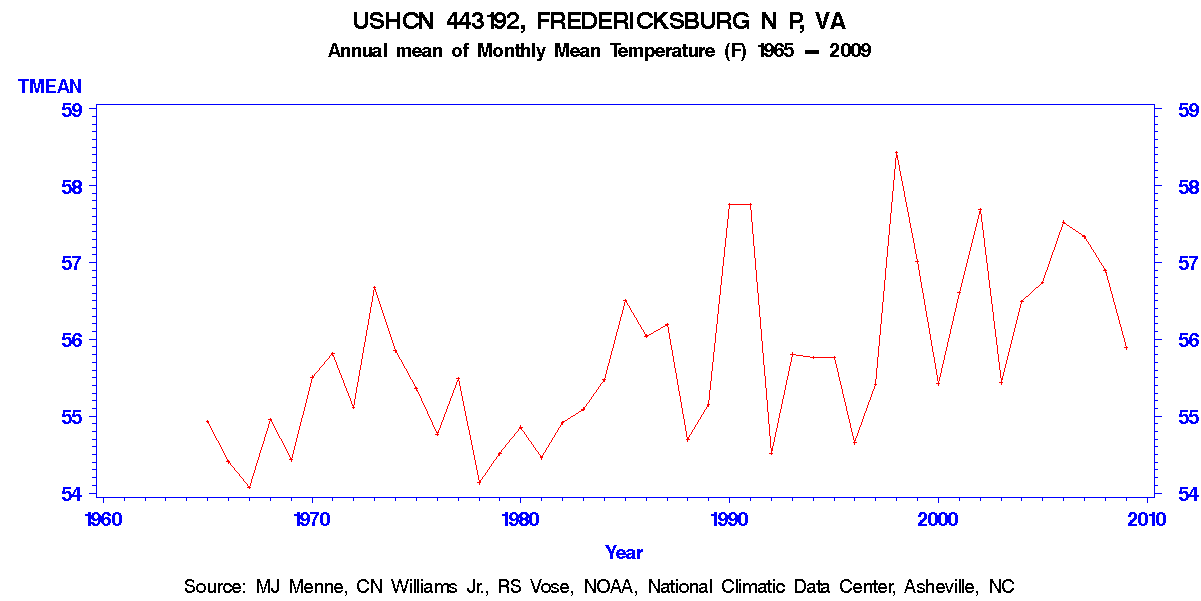
Like Lincoln, the USHCN Fredericksburg adjusted graph shows steady warming since the 1960s. In fact it shows almost identical warming to Lincoln.
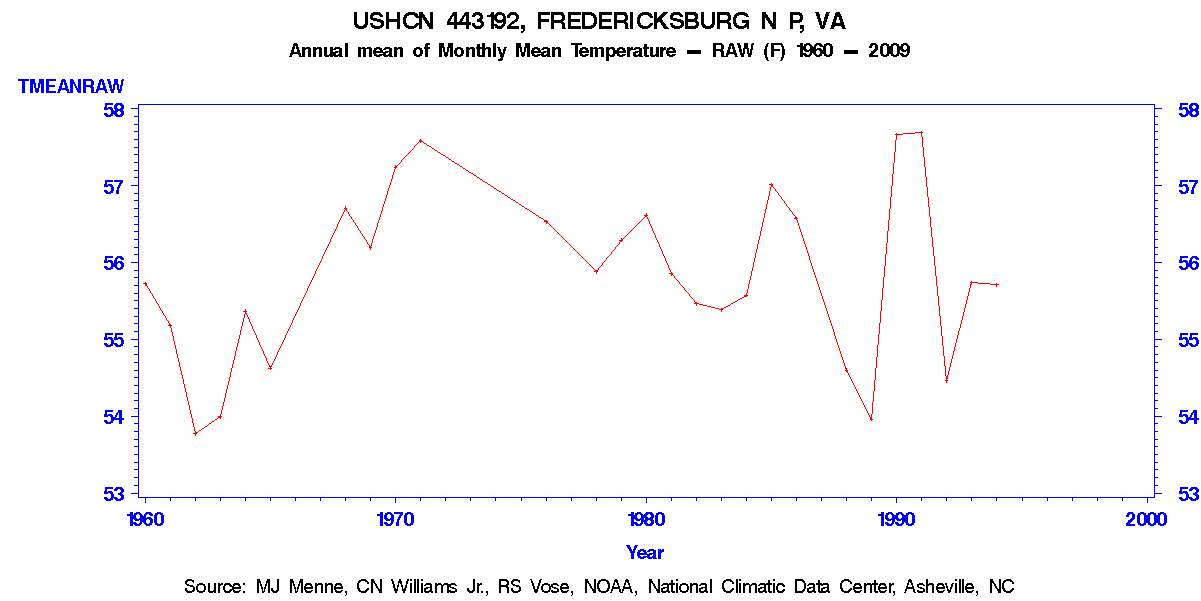
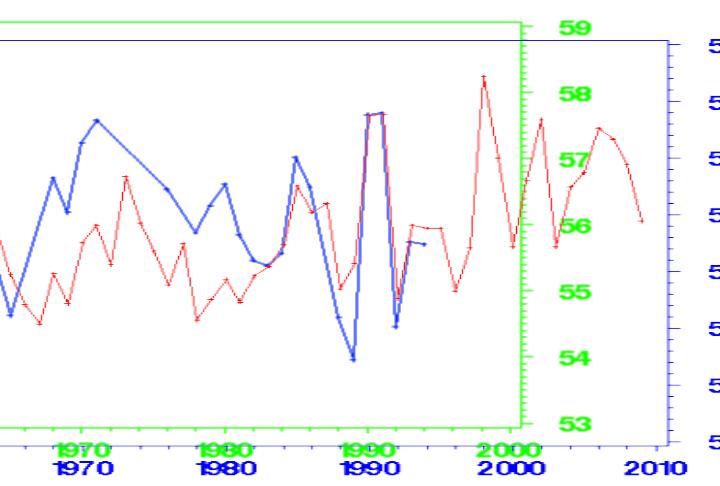
But there is something a little different about the Fredericksburg graph of raw data. Can you spot it below?
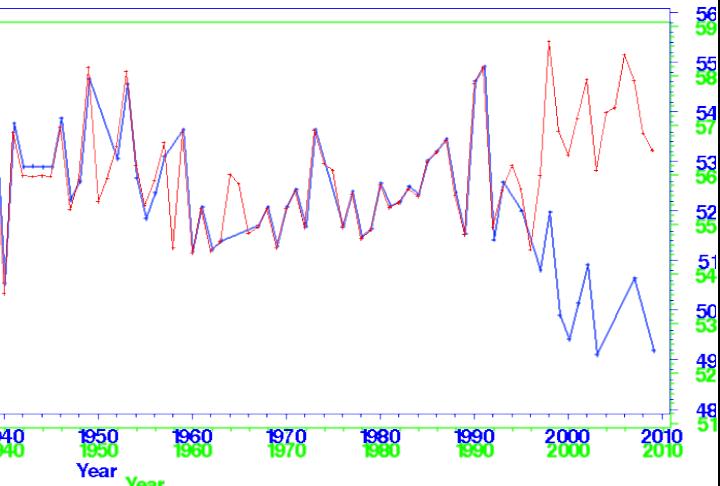
Besides the obvious fact that the adjustments completely change the shape of the graph, it turns out that USHCN doesn’t actually have any readings at Fredricksburg after 1994. Raw data shown in blue below, adjusted in red.
So where did they get the post -1994 data for Fredricksburg?
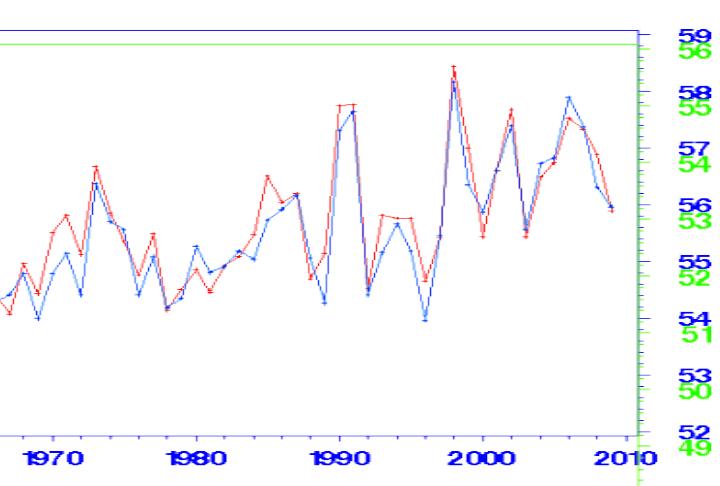
You guessed it. They took the adjusted upwards trend from Lincoln, added three degrees to it, and basically plastered it onto the end of the Fredricksburg graph. Fredericksburg in blue below, Lincoln in red.
How cool is that? They were able to take the manufactured Lincoln rise in temperatures, and “fix” the record of a second station using the same data! They took a downwards temperature trend at Lincoln, flipped it upwards, and got a double global warming bonus from one roll of the dice.
And who would have thought that the weather is more than three degrees warmer just 70 km to the south of Lincoln? We are so lucky to have such clever scientists fixing the data for us.
Otherwise, we would have just assumed that Washington D.C. was getting cooler – like the thermometers say.
.


Okay alarmists. Tell me where the honesty, integrity and scientific method is found in this example. Now do you understand why there are climate skeptics??? Back in 50’s the place where I was raised people would never dare do this as they would have been banished from society. Talk about fraud!! Now please tell me why ANYONE should or could believe anything that these warmist types publish.
The problem is geezer is that this hasn’t been properly investigated. It’s all very well Steve just posting raw and adjusted from different stations, but I doubt this is the full story. Afterall the key word in: “and basically plastered it onto the end of the Fredricksburg graph” is “basically”. The end doesn’t match up with the Fredricksburg identically. I suspect the data originates from another nearby station. Hence why Fredricksburg was adjusted.
To understand what happened would take at least an understanding about how the USHCN adjustment procedure works, as well as looking at all the candidate stations that could be used to adjust this one. Then it would take some work, perhaps shock horror, a full days work to figure out how the adjusted data was processed.
I don’t see anything resembling a sufficient end-of-the-road exhaustive investigation here.
I’ll put you down as volunteering for that.Thanks.
Serioussam
none is required from an amateur position. However evidence suggest a need for a professional review of methods and procedures used for homogenizing the data. (cooking the books)
Tell your Congressman!
im not the one making silly claims. The burden of investigating it properly is on you.
Or at least let your readers know it could be investigated, but you don’t have the time to do it.
Big talker. No action.
You haven’t even demonstrated you understand how the USHCN adjustments are made.
I hope you and your readers at least realize USHCN adjustments are not done by hand.
If you, or other skeptic blogs, really cared about figuring out this you would produce your own US temperature record from the raw station data and see if it differs enough from USHCN to justify these posts.
I have written well over 1,000 articles on this blog and WUWT. I’m sure you read them all.
Serioussam:
Of course they are not done by hand. It is obvious that they take garbage measurements place them in a blender / computer model and using the latest SWAG Al-Gore-Rhythm they do just the correct number of cycles through to provide properly cooked results.
GIGO!
If you think the raw station data is garbage then why should I bother arguing with you over the adjustment methods? It would be like arguing quantum mechanics with a young earth creationist.
Dang, you must be a really smart guy Sam
yea i am i have an IQ of 102 which is higher than average
“I have written well over 1,000 articles on this blog and WUWT”
Don’t worry you will soon overtake WUWT as the most important climate blog, then you’ll have your revenge
Revenge for what?
Seriussam:
From this side of the fence your claims appear to be delusional, not just silly!
Consider the first step of USHCN homogenization from the documentation:
“First, a series of monthly temperature differences is formed between numerous pairs of station series in a region. Specifically, difference series are calculated between each target station series and a number (up to 40) of highly correlated series from nearby stations. In effect, a matrix of difference series is formed for a large fraction of all possible combinations of station series pairs in each localized region. The station pool for this pairwise comparison of series includes USHCN stations as well as other U.S. Cooperative Observer Network stations.”
http://cdiac.ornl.gov/epubs/ndp/ushcn/monthly_doc.html
If you want to understand how the adjustment is made to Lincoln VA, you have to follow that documented procedure. If you want to criticize the adjustment method, you have to at least understand how it works in general, and how it worked in the case of Lincoln VA.
Then in addition if you want to claim conclusions based on the USHCN record are wrong because the USHCN record is wrong, you have to demonstrate your supposed “fixed” method presents a wildly different picture than USHCN does.
But as a first step you have to at least RTFM.
There are no shortcuts to the proper scientific method. Posting graphs of raw and adjusted data of one station and guessturbating imagined conclusions is insufficient.
Serioussam:
I did not read this before posting my last reply and it seems I was just repeating what you say in this post of yours!
To condense:
Proper SWAG applied to Garbage results in Garbage. Is that a fair interpretation of your claim?
Hardly. The problem you guys have is a credibility one.
It’s very very easy to nitpick over individual cases of an adjustment algorithm and just made blanket assertions like you do about “a blender / computer model and using the latest SWAG Al-Gore-Rhythm”
Very nice and political and all that. But where’s your scientific argument?
Skeptics have had over 10 years to point out where surface record algorithms are wrong. Skeptics have had over 10 years to produce their own algorithm that “does it right”. They’ve had over 10 years to present what difference the “right” method makes.
Yet skeptics just blather on with the same old silly station adjustment posts and assertions such as yours.
Think USHCN record is wrong? Point out which part of the algorithm is wrong. Then demonstrate how the US temperature record changes when that is corrected.
Until then you’ve got nothing. It’s sad really because you are just going to expend your lives screaming about this but be ignored by the world that matters.
Some of you guys cannot fathom why despite all your noise GISTEMP still exists and Dr Hansen is still in a job. The reason is he does science. You don’t.
There is definitely a credibility problem. They have altered their own data over and over again to increase warming, while maintaining a high profile political posture towards that end.
http://stevengoddard.files.wordpress.com/2010/10/1998changesannotated.gif?w=500&h=355&h=355
The Washington Graph is connected to the Lincoln Graph, the Lincoln Graph is connected to the Fredricksburg Graph, the Fredricksburg is connected to the GISS crap, now hear the word of the Gore!
Another smoking gun. Another fraud. Marc, are you reading this? Is an investigation planned?
Kill the head and the body will die. Kill the Global Mean Temperature fraud, and the whole house of cards comes down.
If a congressional investigation can prove the temperature has actually FALLEN in the last 70 years, the 12 headed climate monster (and his master, Karl Marx) will be no more.
Pingback: The Virginia Triangle | Real Science
Homogenized to the point of meaninglessness.
Take a belief system (AGW).
Find stations with missing data (or data that doesn’t conform to the belief system).
Adjust that record with data from a ‘high quality’ record station. WUWT covered a prime example of such a ‘quality’ station back in July … remember Carefree, AZ ?
http://wattsupwiththat.com/2010/07/12/carefree-record-high-temperatures-in-arizona/
http://wattsupwiththat.com/2010/07/14/photos-noaas-carefree-climate-station/
Just look at that … temperature sensor installed at roof level on a building surrounded by asphalt. What could possibly go wrong with that?
Is it any wonder that these climate scientists look like pretend scientists catering to the whims of activist politicians?
Hmm. The shapes of the two temperature plots aren’t identical. It looks, at a guess, like they in-filled the Fredricksburg data by homogenizing data from the Lincoln station and other, more distant ones (and therefore weighted much less). This will, I’m sure, be considered entirely honest and above board. Whether it is good science is an entirely different matter…
Who is in charge of USHCN? Don’t they want to respond to this? So much for the adjustment for ‘heat islands’………….
Sarcasm on:
Hey Guys! You can’t just cherry pick one station, err… two stations, and…(No, that’s not it!) Oh yeah! You can’t just cherry pick one thousand seven hundred and forty three stations, and just because they have a little honest human error in their temperature interpretation, claim that the entire case for CAGW is discredited! For God’s sake, educate yourself a little! Learn some science! It’s simple!
Sarcasm off:
Environmentalists and nannies cherry-pick data, take quotes out of context, misapply and misuse analytical and statistical methods, spin, and just plain lie in order to push their agenda. They have been doing this since”Silent Spring” and the DDT farce, and they will continue to do it until the populace wakes up and recognizes what is going on.
Delaware OH is another with fictitious data. It hasn’t had a daily reading since 1/31/2001, but USHCN has it chugging out evidence of warming through 2006 at least (last data I checked was USHCN2, which quit in 2006). I’ve reported this on Surface Stations.
Where’s the alarmist contingent with the “cherry-picking” and “insufficient sample” drivel? Des?
Great stuff here SG, but could you condense it down to one or two sentences? I have a twitter bot to argue with.
USHCN is adjusting a downwards trend at Lincoln into an upwards trend, and then using the upwards adjusted trend to fill in missing readings from other stations.
except you haven’t demonstrated that last part.
I’m assuming that readers have a brain. Might be a mistake in some cases.
I too would love to see some warmist apologists come here and try to defend this warm-science stench.
I worked in a calibration centre for thirteen years. Now even though it wasn’t a very high standard lab, the people peripheral to the centre used to be amused at our fastidiousness. They were actual technicians who used the equipment that we calibrated, not just people off the street. But I’m sure that even the people on the street, if they were made aware, would be appalled at the warm-scientists’ corrupt methodology and their contempt for integrity with the data. If so, that places these scientists’ science below street level.
They have been caught red handed again. But will this stop them? I don’t think it will because so far it hasn’t. Unfortunately these compulsive charlatans, who pose as scientists, have an agenda and no shame and will keep doing it probably until they have to face court action. I believe that is what needs to happen.
It’s a complicated task and it’s not possible to produce a perfect record. Even the simplest method will lead to stations with odd data, even some errors. More complex methods to fix various problems will still not fix all issues and some additional problems will occur. Many will not understand this unless they try to produce a US temperature record themselves.
Most fields of science assume a Gaussian distribution of error for a large sample size, and leave the data un-manipulated.
actually you are wrong. Most fields of science try to identify the biggest errors and correct for them. By most I of course mean 87% of fields.
Pingback: This must be the best laugh of the week for climate skeptics : Stop The ACLU
serioussam is right!
Homogenising this sort of data is very tricky. The first problem is that we don’t have any data for Fredricksburg so we extrapolate it from a matrix of nearby highly correlated stations. Well, there is only one of those in this case, at Lincoln. Since Lincoln is a bit to the North we have had to add on an arbitrary 3 deg. to make sure we get the desired warming effect. Otherwise it might appear that things are cooling and we can’t have that. Then, to get a good slope on the graph we take the precaution of reducing the temperature of the early years. Now, since we have added 3 deg at the end of the graph and subtracted something at the beginning this probably balances out – so it’s fair – and the graph looks the way we want it it.
All this has of course been peer reviewed to meet the highest quality standards practised in the field of climatology. Unfortunately, we’ve lost the actual records of these very precise adjustments – so no point putting in a Freedom of Information request or anything.
WOW Good description of SOP for Climatology.
Pingback: Roundup « Eternity Matters