Reggie claims that 2013 Arctic summer temperatures have been similar to 2007
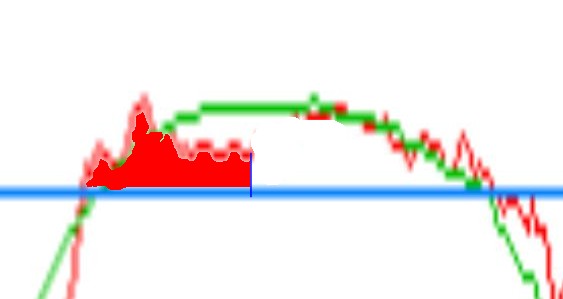
Let’s check his claim out. The graph below has the 2013 area (degree-days) above freezing colored in red.
COI | Centre for Ocean and Ice | Danmarks Meteorologiske Institut
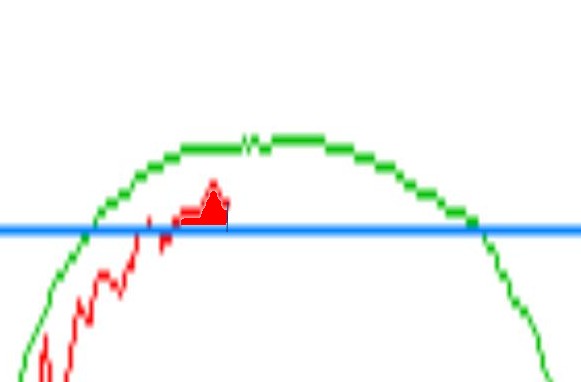
The next graph shows the same thing for 2007. Note that the YTD number of degree-days above freezing in 2007 was almost ten times greater than 2013.

COI | Centre for Ocean and Ice | Danmarks Meteorologiske Institut
The 10X difference in area is unrealistic however. Given that the latent heat of melting ice significantly depressed the temperature in 2007, it is safe to assume that the amount of heat available for melting ice in 2007 was much more than 10X the amount of heat in 2013.


even with the higher temps….NASA still said it was the wind in 2007
“Nghiem said the rapid decline in winter perennial ice the past two years was caused by unusual winds. “Unusual atmospheric conditions set up wind patterns that compressed the sea ice, loaded it into the Transpolar Drift Stream and then sped its flow out of the Arctic,” he said. When that sea ice reached lower latitudes, it rapidly melted in the warmer waters.”
“The winds causing this trend in ice reduction were set up by an unusual pattern of atmospheric pressure that began at the beginning of this century,” Nghiem said.
http://www.nasa.gov/vision/earth/lookingatearth/quikscat-20071001.html
Off by one order of magnitude? That’s actually excellent performance for Climate Scientists/Alarmists. They can’t even come close to that on temps while constantly adjusting decades old data to fit their models.
When you have to pick cherries like that, it shows you are getting desperate
Have you seen the latest Bremen ice concentration map?
http://www.iup.uni-bremen.de:8084/ssmis/arctic_SSMIS_nic.png
There is a massive area north of 90 that is showing 50 percent concentration and if you enlarge the map you can see areas streaks of blue, which is concentration below ten percent.
All that unprecedented cold is eating gigantic holes in the ice north of 90.
Here is a video showing that magical place north of 90N
http://www.youtube.com/watch?v=WANNqr-vcx0
Why do you always have to resort to that kind of behavior, What do you have against using science as your rebuttal?
ROFLMAO You really don’t understand what the problem is with what you wrote.
Well Steve, it was above it on the page, so it must have been north. North is always at the top!!!
You knew what I meant, north of 80. I need to be wearing my glasses. at least I admit my errors.
When are you going to do the same?
I admit that Maslowski was correct. The Arctic is indeed ice-free in 2013.
It looks like the rowing team can take a refreshing swim when they get to Jenny Lind Island and stay cool through The Royal Geographic Society Island / King William Island area:)
What is your obsession on the Arctic cap changes based on anyway?
Reggie, sponsored by Brawndo, sponsored by Vallely, is sponsored by the rowing team to spread misinformation.
And by misinformation I assume you are referring to actual science from the reality based universe.
If you really want to make yourself useful, you should see about volunteering for the Arctic rowing expedition. Maybe you can convince them that’s it not ice out there, just clouds.
(I should follow my own advice … should be “that it’s” of course.)
Now you’re scrapping bottom with that out of context Maslowski quote
Do know what sarcasm is Reggie?
Sorry to nitpick, but the word is “scraping”. Surely you don’t think you’re comments are so vital that there’s not time to proof them before you post.
You know, Grace wasn’t bad when she was a young-un. Even if she was floating around north of 90.
Yeah wonder what happened. Even she is a victim of climate change.
http://en.wikipedia.org/wiki/File:GraceSlick2008.jpg
The freezing point of seawater is -1.8C. The melting point of snow and freshwater ice is 0C.
Latitudes north of 80 typically have an almost 100 percent cover of snow and freshwater ice, this constrains the temperatures to the melting point of snow and freshwater ice. This is visible on all the DMI graphs in the data set.
2013 is an anomaly because for the first time we see large areas north of 80 with low sea ice concentrations. This has altered the temperatures. The air temperatures are now being constrained by the ocean temperatures.
Bottom melt accounts for about two-thirds of the total arctic ice melt. Bottom melt is greatest in the marginal ice zones. 2013 has seen large areas of the central arctic turned into a marginal ice zone.
If you don’t understand the physics of ice, ice melt, and the arctic energy budget – then it might be difficult to explain how a year with DMI showing temperatures consistently below freezing can also be the year with the lowest sea ice concentration north of 80. All that open water just magically appeared despite below freezing temperatures and absolutely no melt. Yeah, right 🙂
Multiyear ice is fresh water, dumbass.
Wind and currents never move ice and cause cracks in Kevin’s bizarre world.
So then, we agree that this particular inter-glacial is of the never-ending type?
It’s time to celebrate, wouldn’t you agree?
The areas of low concentration are not MYI .
Strike one, dumbass.
The surface of all sea ice is fresh water, and by the end of the summer almost all of the salt has drained out.
Are you looking to be spam too?
Here’s another Reggie classic from an earlier post. I think he and Kevin are teleconnected:
Reggie, sponsored by Brawndo says:
July 5, 2013 at 11:27 pm
What did I say the was factually incorrect? I qualified that statement with the word mostly.
At what temperature does sea ice met?
Hint, it isn’t 273K
[he means ‘melt’, of course, not ‘met’]