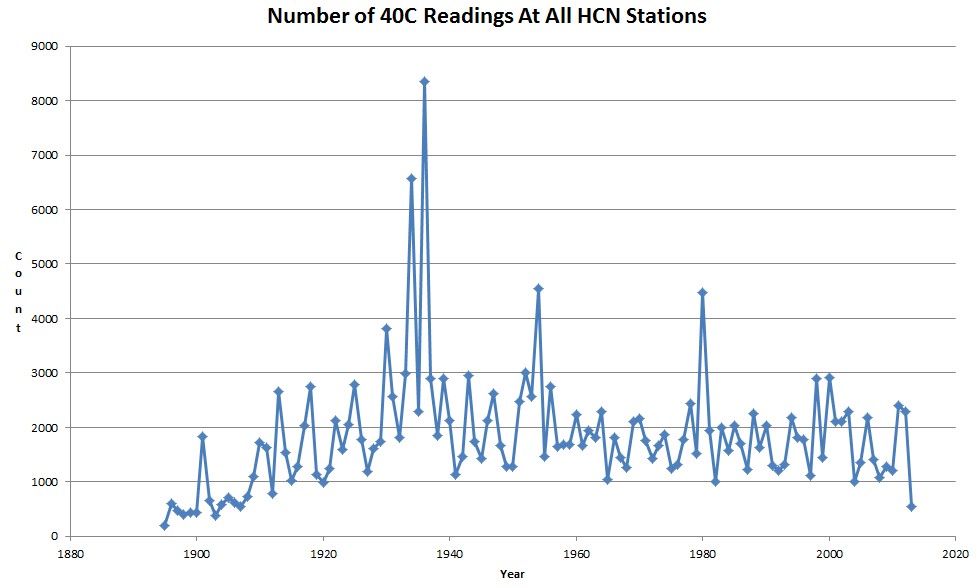
The graph below plots the number of 40C readings at all GHCN HCN stations. The five hottest summers were 1934, 1936, 1954, 1980 and 1930. No summer above 350 PPM CO2 has come even close. The current summer will finish with the fewest 40C readings in 100 years.
NOAA claims that recent summers have been the hottest, because they are seeking funding and have no qualms about lying in order to obtain money.
And then there is Hansen, the ultimate climate disinformer.
We conclude that extreme heat waves, such as that in Texas and Oklahoma in 2011 and Moscow in 2010, were “caused” by global warming, because their likelihood was negligible prior to the recent rapid global warming.
US Politics | AMERICAblog News: Quarter to half of species on earth may die from global warming


Reblogged this on Gds44's Blog.
Reblogged this on News You May Have Missed and commented:
US Summers Have Cooled Dramatically Over The Last 80 Years
This guy, Appell, has gone completely off the rails. Either that or he’s involved in a scheme to sue the coal industry for his big payday.
DavidAppell
“Coal is a deathly fuel, and those who advocate for it are heartless bastards.
Clean energy is the morally correct position. Be moral and stop polluting the world.”
http://dailycaller.com/2013/08/05/michael-mann-climate-charlatan/2/
He has a lot of money invested in green energy scams and has lost his mind.
David is really really mad at China, India, and all of Africa……..
Work on developing green energy, but in the meantime we better exploit what is inexpensive and readily available. The effect on climate is negligible and cheap energy is great for the economy and humanity.
I agree with Andy. And I’d like to add that access to cheap energy can help developing countries get over the hump of the Demographic Transition faster.
Caveats: This applies to countries with non-theocratic, relatively non-corrupt governments, which respect the rights of women — as well as the property rights of family farmers and of people who run small businesses.
That precludes the US
Hey Steven,
I have a stooopid question: Does your graph use raw data? Or is it adjusted data, which cools past measurements and warms up recent ones? If it’s the latter, then the cooling trend is worse than we thought. Help, we’re all gonna freeze to death!
However I was under the impression that raw temperature data from individual stations is treated as a National Security item. If you don’t know the secret Warmist handshake, you’re SOL.
Texas – let’s have some fun w/ Texas . . but don’t mess w/ them.
Using NOAA’s own “Climate at a Glance.”
Annual temperature 1895 – 2012: http://www.ncdc.noaa.gov/cag/time-series/us/41/00/tmp/ytd/12/1895-2013?base_prd=true&firstbaseyear=1901&lastbaseyear=2000&trend=true&trend_base=10&firsttrendyear=1895&lasttrendyear=2012
Texas Heating Days – a meaningless long term trend – but look at the trend from 1980 – present:
http://www.ncdc.noaa.gov/cag/time-series/us/41/00/hdd/ytd/12/1895-2013?base_prd=true&firstbaseyear=1901&lastbaseyear=2000&trend=true&trend_base=10&firsttrendyear=1895&lasttrendyear=2012
Texas Precipitation 1895-2012 – Run for them stock ponds:http://www.ncdc.noaa.gov/cag/time-series/us/41/00/pcp/ytd/12/1895-2013?base_prd=true&firstbaseyear=1901&lastbaseyear=2000&trend=true&trend_base=10&firsttrendyear=1895&lasttrendyear=2012
Nothing happening in Texas, but good ole smoked brisket.