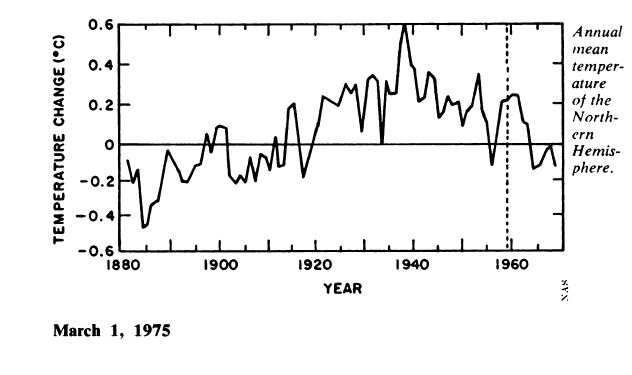
The March 1, 1975 edition of Science News included the graph below. It showed that Northern Hemisphere temperatures dropped by 0.4 degrees between 1940 and 1970.
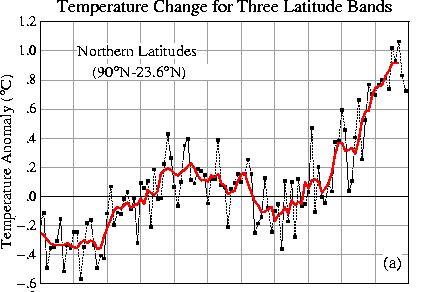
The current GISS northern hemisphere graph (1900-present) is shown below. It shows a smaller drop.
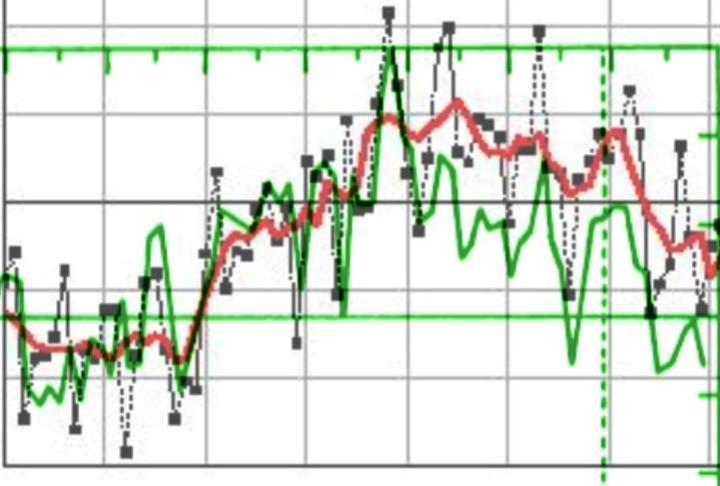
The image below shows the 1975 graph (green) overlaid on the GISS graph. Both graphs have the same scale. The 1975 graph is offset by 0.25 degrees.
Note that both graphs agree closely from 1900 to 1940. But GISS shows a much smaller cooling from 1940 to 1970. The latitude bands are not identical, but the missing tropics show less cooling- which would make the discrepancy larger if they were included in the GISS graph.


Just in case “jeez” makes his way over here, he left the following in the now closed WUWT thread:
Here is the current anomaly data for every month of 1998, as of July 30th 2010,
55 101 68 67 82 87 84 75 47 57 53 64
Here is the monthly anomaly data for 1998 from 2000 (file dated January 21st 2001) which I scraped for John Goetz back in 2008. It is no longer available at archive.org as GISS has stepped in to disable archiving. Remember I never said they were nice guys.
59 93 69 80 76 71 80 71 43 53 53 69
If you look at the information at the top, you obtain the anomaly data in degrees celsius by diving by 100.
Averaging the year 2010 data for 1998 and diving by 100 I get: 0.070° C
Averaging the year 1999 data for 1998 and diving by 100 I get: 0.068° C
So the estimation algorithm has actually made the 1998 anomaly 0.02° C higher in 2010 than the the value calculated and used in 1999/2000.
Or in other words exactly the opposite of what Steven Goddard has claimed has occurred. The GISS algorithm has not cooled the past in this case of the crucially important 1998. It has warmed it.
Checkmate.
Game Set Match.
The Fat Lady has sung.
Just so you know, GISS uses Dec through Nov to calculate annual numbers. So the correct series should be:
latest:
49 55 101 68 67 82 87 84 75 47 57 53
and
scraped from 2001:
50 59 93 69 80 76 71 80 71 43 53 53
And when I (correctly – unlike jeez) add and divide by 100, I get:
latest: 0.6875
scraped from 2001: 0.665
So GISS has indeed WARMED 1998. Feel free to recheck my numbers though. I could be wrong.
Crap! I was really trying to make the opposite point because I though jeez was unnecessarily harsh. It does look like he’s right though. But with those wide adjustments in temperature, particularly February and June, who knows. GiSS might cool 1998 in one of their “reruns”.
JR,
It looks like the GISS “global temperature” graph wasn’t actually global after all.
The issue in this article is a different one though.
I think you mean “1890 to 1940” and not 1990 to 1940.
[Fixed, thanks]
The best way to slay the warming vampire is upon the change of administrations, remove messers Hansen, Schmidt, Serrez, et al, and get a legitimate team to re-examine these numbers. A revelation that earth had never really exceeded highs of the 30’s/40’s could be the wooden stake needed to end this nightmare.