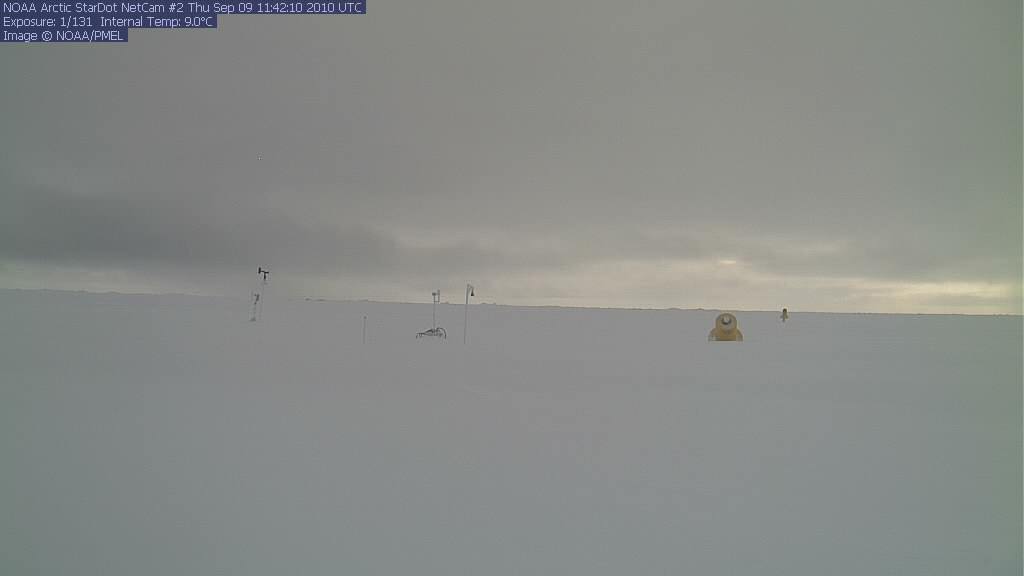
http://psc.apl.washington.edu/northpole/webphotos/noaa2.jpg
The Sun will set for the winter at the North Pole in a little over a week. It is just barely above the horizon now, and the light is getting “flat.”
Skiers are familiar with this. When the Sun gets low and dim in the late afternoon, it becomes difficult to make out any details of the snow surface. The snow becomes featureless.
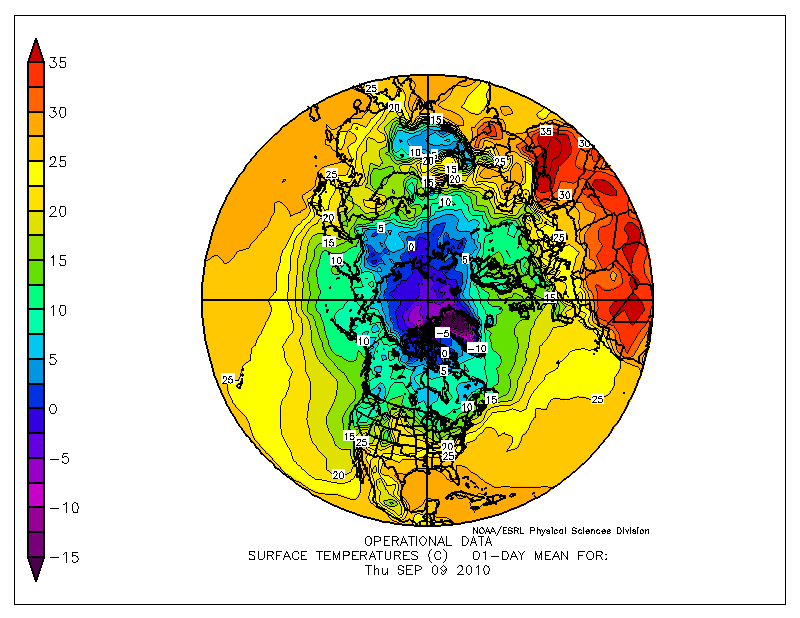
Temperatures in the Arctic are getting very cold now, with many regions close to minus 10ºC.
http://www.esrl.noaa.gov/psd/map/images/fnl/sfctmp_01.fnl.gif
You can compress the ice all you want, but it isn’t going to melt out at minus 10ºC. I don’t see a credible path to an ice-free Arctic without a large increase in summer temperatures.
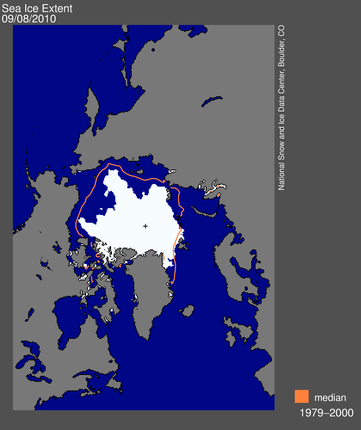
http://nsidc.org/data/seaice_index/images/daily_images/N_daily_extent.png


Looks like the Arctic’s on the cusp. So far this month JAXA’s numbers have followed a pattern where the second revised value for the day reduced the extent from the preliminary value, until yesterday. Yesterday’s preliminary value of 4.977 mil km² has been revised upward to 4.989 mil km². It just might be another speed bump. OTOH, the “melt” could flatline before it starts the winter extent increase.
One thing I have learned this year is that there are limits to what can be predicted. 2007 started out with a lot of ice and the winds howled. Unless you can forecast the wind all summer (which no one seems to be able to do) the error range is going to be +/15%. NCEP was having difficulty forecasting three days in advance.
…It’s so flat ..the “myth” that. refraction can make water reflect – – is true (now) !
PS: I’ve been assembling all the indexes & the sites. They have a strict Order to their size:
(Long numbers are Data, rest meassured off Charts):
Year:_MINIMA_(07-09):____2007____ 2008 ____ 2009 ____ 2010: Spt1 __Spt *7/8
AREA AMSR Cryo/ijis_____2.9194391_3.0035558 3.4265975_3.244222_*3.0876937
30%Ext.SSMI DMI________ 3.06______3.41_____3.84______4.00______3.80
AREA Amsr U.Hamburg____ 3.50330___3.81714__4.22780___3.98389 (Aug 31)
…Next 4 all U. of Bergen :
AREA AMSR @ Topaz_____???.?______???.?____ 4.40______4.07______3.89 T
AREA SSMI Norsex_______ 3.62* _____3.87*____4.61*_____ 4.30______4.20
AREA SSMI Nansen_______3.293737 ( = NORSEX*see note)_ 4.350662__4.120683
AREA SSMI @ Topaz______???.?______???.?____4.82_______4.49______4.16 T
15%Ext AMSR Hamburg____3.85724___4.27124__4.80018____4.77826 (31)
15%Extent_Amsr_Bremen___4.32*_____4.64*____5.31*______5.00______4.67
“Extent SSMI NSIDC_______4.17______???.?____ 5.10 ______ 5.2_______4.78
“(a Blogger=NSIDC data)____4.24 _____ 4.64_____5.24__(ends)
“Extent JAXA/ i j i s _______ 4.267344__4.707823_5.291094__ 5.332344__4,965,781
“Ext.AMSR @ Topaz_______???.?______???.?____5.47______ 5.42______5.07 T
“Ext.SSMI NORSEX/ROOS__4.74______5.23_____5.88______ 6.17______5.79
“Ext.SSMI @ Topaz_________???.?_____???.?____ 6.04______ 6.26______5.87
(1) Bergen U. added 10% to Older Data to match a Newer Algorithm ( = why the Nansen/Norsex Discrepancy is ONLY in 2007). NSIDC kept the Old Algorithm; Bremen made one of the 2 adjustments … maybe added 7 or 8 % ?? (NSIDC explanation about 60% down the page at http://nsidc.org/data/docs/noaa/g02135_seaice_index/index.html#acquisition_proc
(2) SSMI = is used by DMI, NSIDC, & Norsex/Nansen … AMSR = JAXA, Hamburg, Bremen, Cryo.
(3) I have assumed TOPEX’s legend has SWITCHED AMSR & SSMI, as AMSR typically gives Lower values elsewhere – – I COULD BE WRONG.
(4) Topex excludes East Greenland Sea Ice.
Sources:
Cryo AREA: http://arctic.atmos.uiuc.edu/cryosphere/timeseries.anom.1979-2008
DMI 30% Ext.@ http://ocean.dmi.dk/arctic/icecover.uk.php
Bergen University:
_Nansen AREA @ http://www.nersc.no/main/index2.php (bottom of page)
_Topex @ http://arctic-roos.org/forecasting-services/topaz/topaz-model-forecast (2nd row)
_NORSEX/ROOS @ http://arctic-roos.org/observations/satellite-data/sea-ice/ice-area-and-extent-in-arctic
HAMBURG @ ftp://ftp-projects.zmaw.de/seaice/AMSR-E_ASI_IceConc/area-extent/
BREMEN AMSR @ http://iup.physik.uni-bremen.de:8084/amsr/ice_ext_n.png
NSIDC: http://nsidc.org/data/seaice_index/images/daily_images/N_timeseries.png
JAXA Extent @ http://www.ijis.iarc.uaf.edu/seaice/extent/plot.csv
… “Cryo” Data is actually from JAXA/ijis calculations.
I hope the chart lined up.
Temperatures in the Arctic are getting very cold now, with many regions close to minus 10ºC.
‘Many regions’ being the Greenland icecap! Meanwhile Bjorn Ousland sailing to the NW Passage east of Barrow is measuring 5ºC water temperatures.
There isn’t any ice within 500 miles of Barrow, that is why the water is warm. You can get the same information from an NOAA SST map.
Really, what’s this Scotch mist?
http://ice-glaces.ec.gc.ca/prods/WIS40CT/20100910180000_WIS40CT_0005182900.gif
I have no idea what is going on in the Arctic, temperatures are falling fast but ice extent is still being lost, this has got to stop soon.
Water temperatures have a strong impact on the melt, and I’m guessing they lag the air temps by a good bit. Think of putting tap water in your freezer.
-Scott
A better analogy is to put a glass of water with ice cubes in your freezer. If there is floating ice nearby, the water temperature is very close to the freezing point.
I get your explanation but what has happened in the last week in the arctic still makes no sense to me.Why would ice extent remain fairly stable when air temperatures are high but fall when air temperatures fall?Why would the temperature of the arctic ocean rise last week?Wind maybe?