BOM has erased the record heat of Australia’s past, using the excuse that the thermometers weren’t shaded properly – but that claim isn’t supported by the historical record.
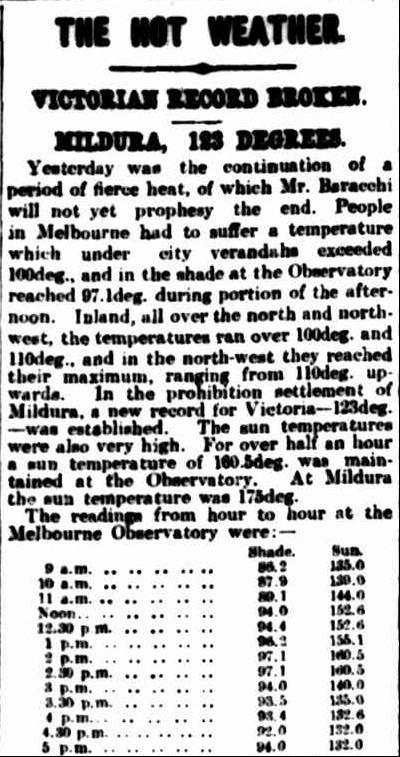
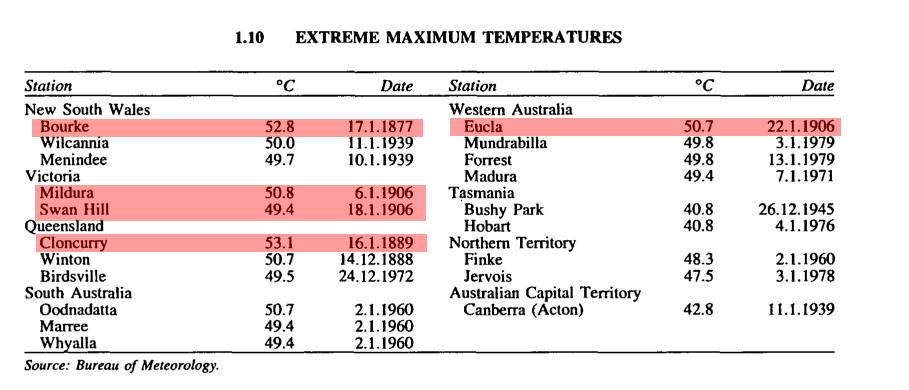
“Some of the highest country readings are given below. It will be seen that the North-western district had the worst of if—Mildura, 123deg.; Swan Hill, 118deg.; Donald, 117deg.; Beulah, 116deg.; Pyramid Hill and Hopetoun, 115deg.; and Charlton, 114deg.,
“Mildura, 123 deg., on January 5, 1906,” is now the highest shade reading that an official Victorian ther-mometer has ever registered. Previously the record was “Mildura 121½ deg., on January 30, 1904.” The record of 123 deg., at Mildura was notified to the Observatory; “The Argus” correspondent notified 122½ deg.
Officers at the Observatory rely on the records reported to them. The thermometers are supplied from the Observatory, and are reliable instruments, and the screens and other devices by means of which the “shade” is produced are the same as those in use at the Observatory itself.”
06 Jan 1906 – THE HOT WEATHER. – Trove
BOM 1995:
13010_1995_Bk77.pdf
BOM 2024:
Climate extremes and records, Bureau of Meteorology
CSIRO used to know about the heat of the past.


PH530209
But everything before 1910 has been erased.

Australian climate variability & change – Time series graphs
BOM uses thermometers next to twenty lanes of asphalt, but rejects well sited thermometers from the past.


Temperature hits all-time record in Sydney
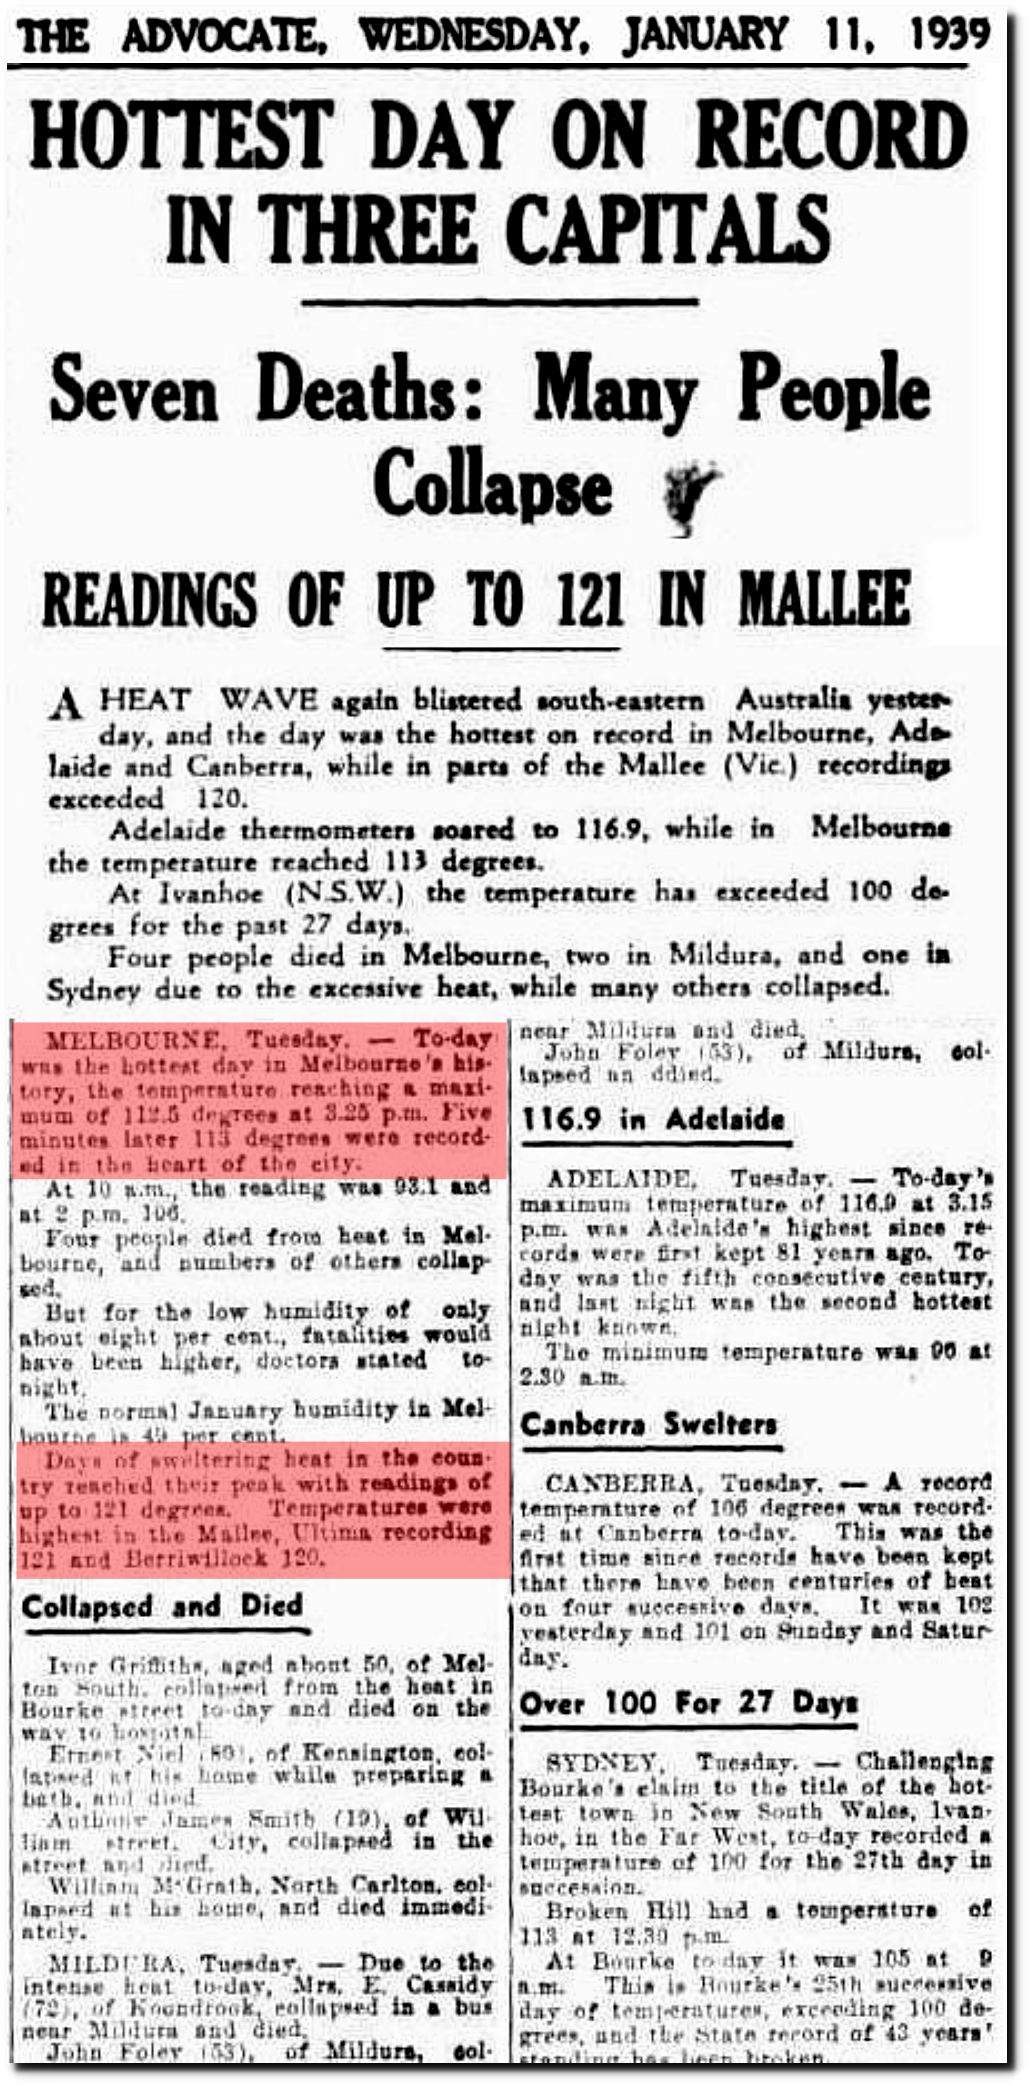
11 Jan 1939 – HOTTEST DAY ON RECORD IN THREE CAPITALS Seven Deaths: Many People Collapse – Trove
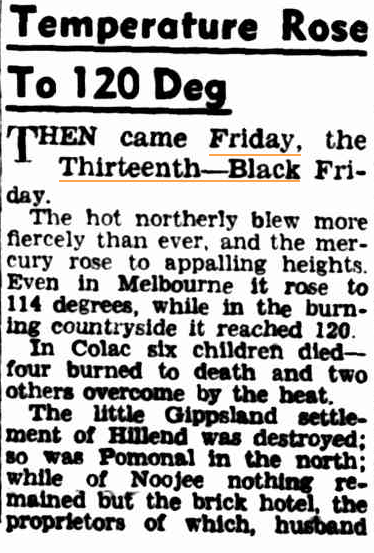
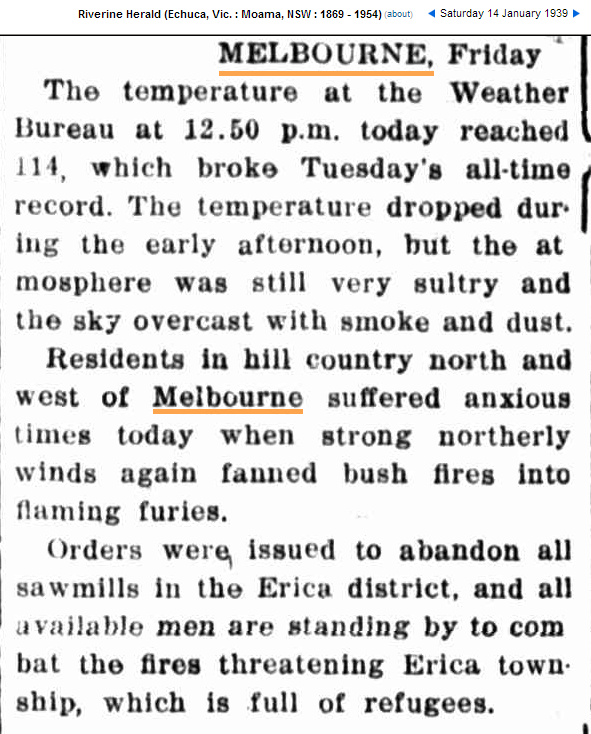
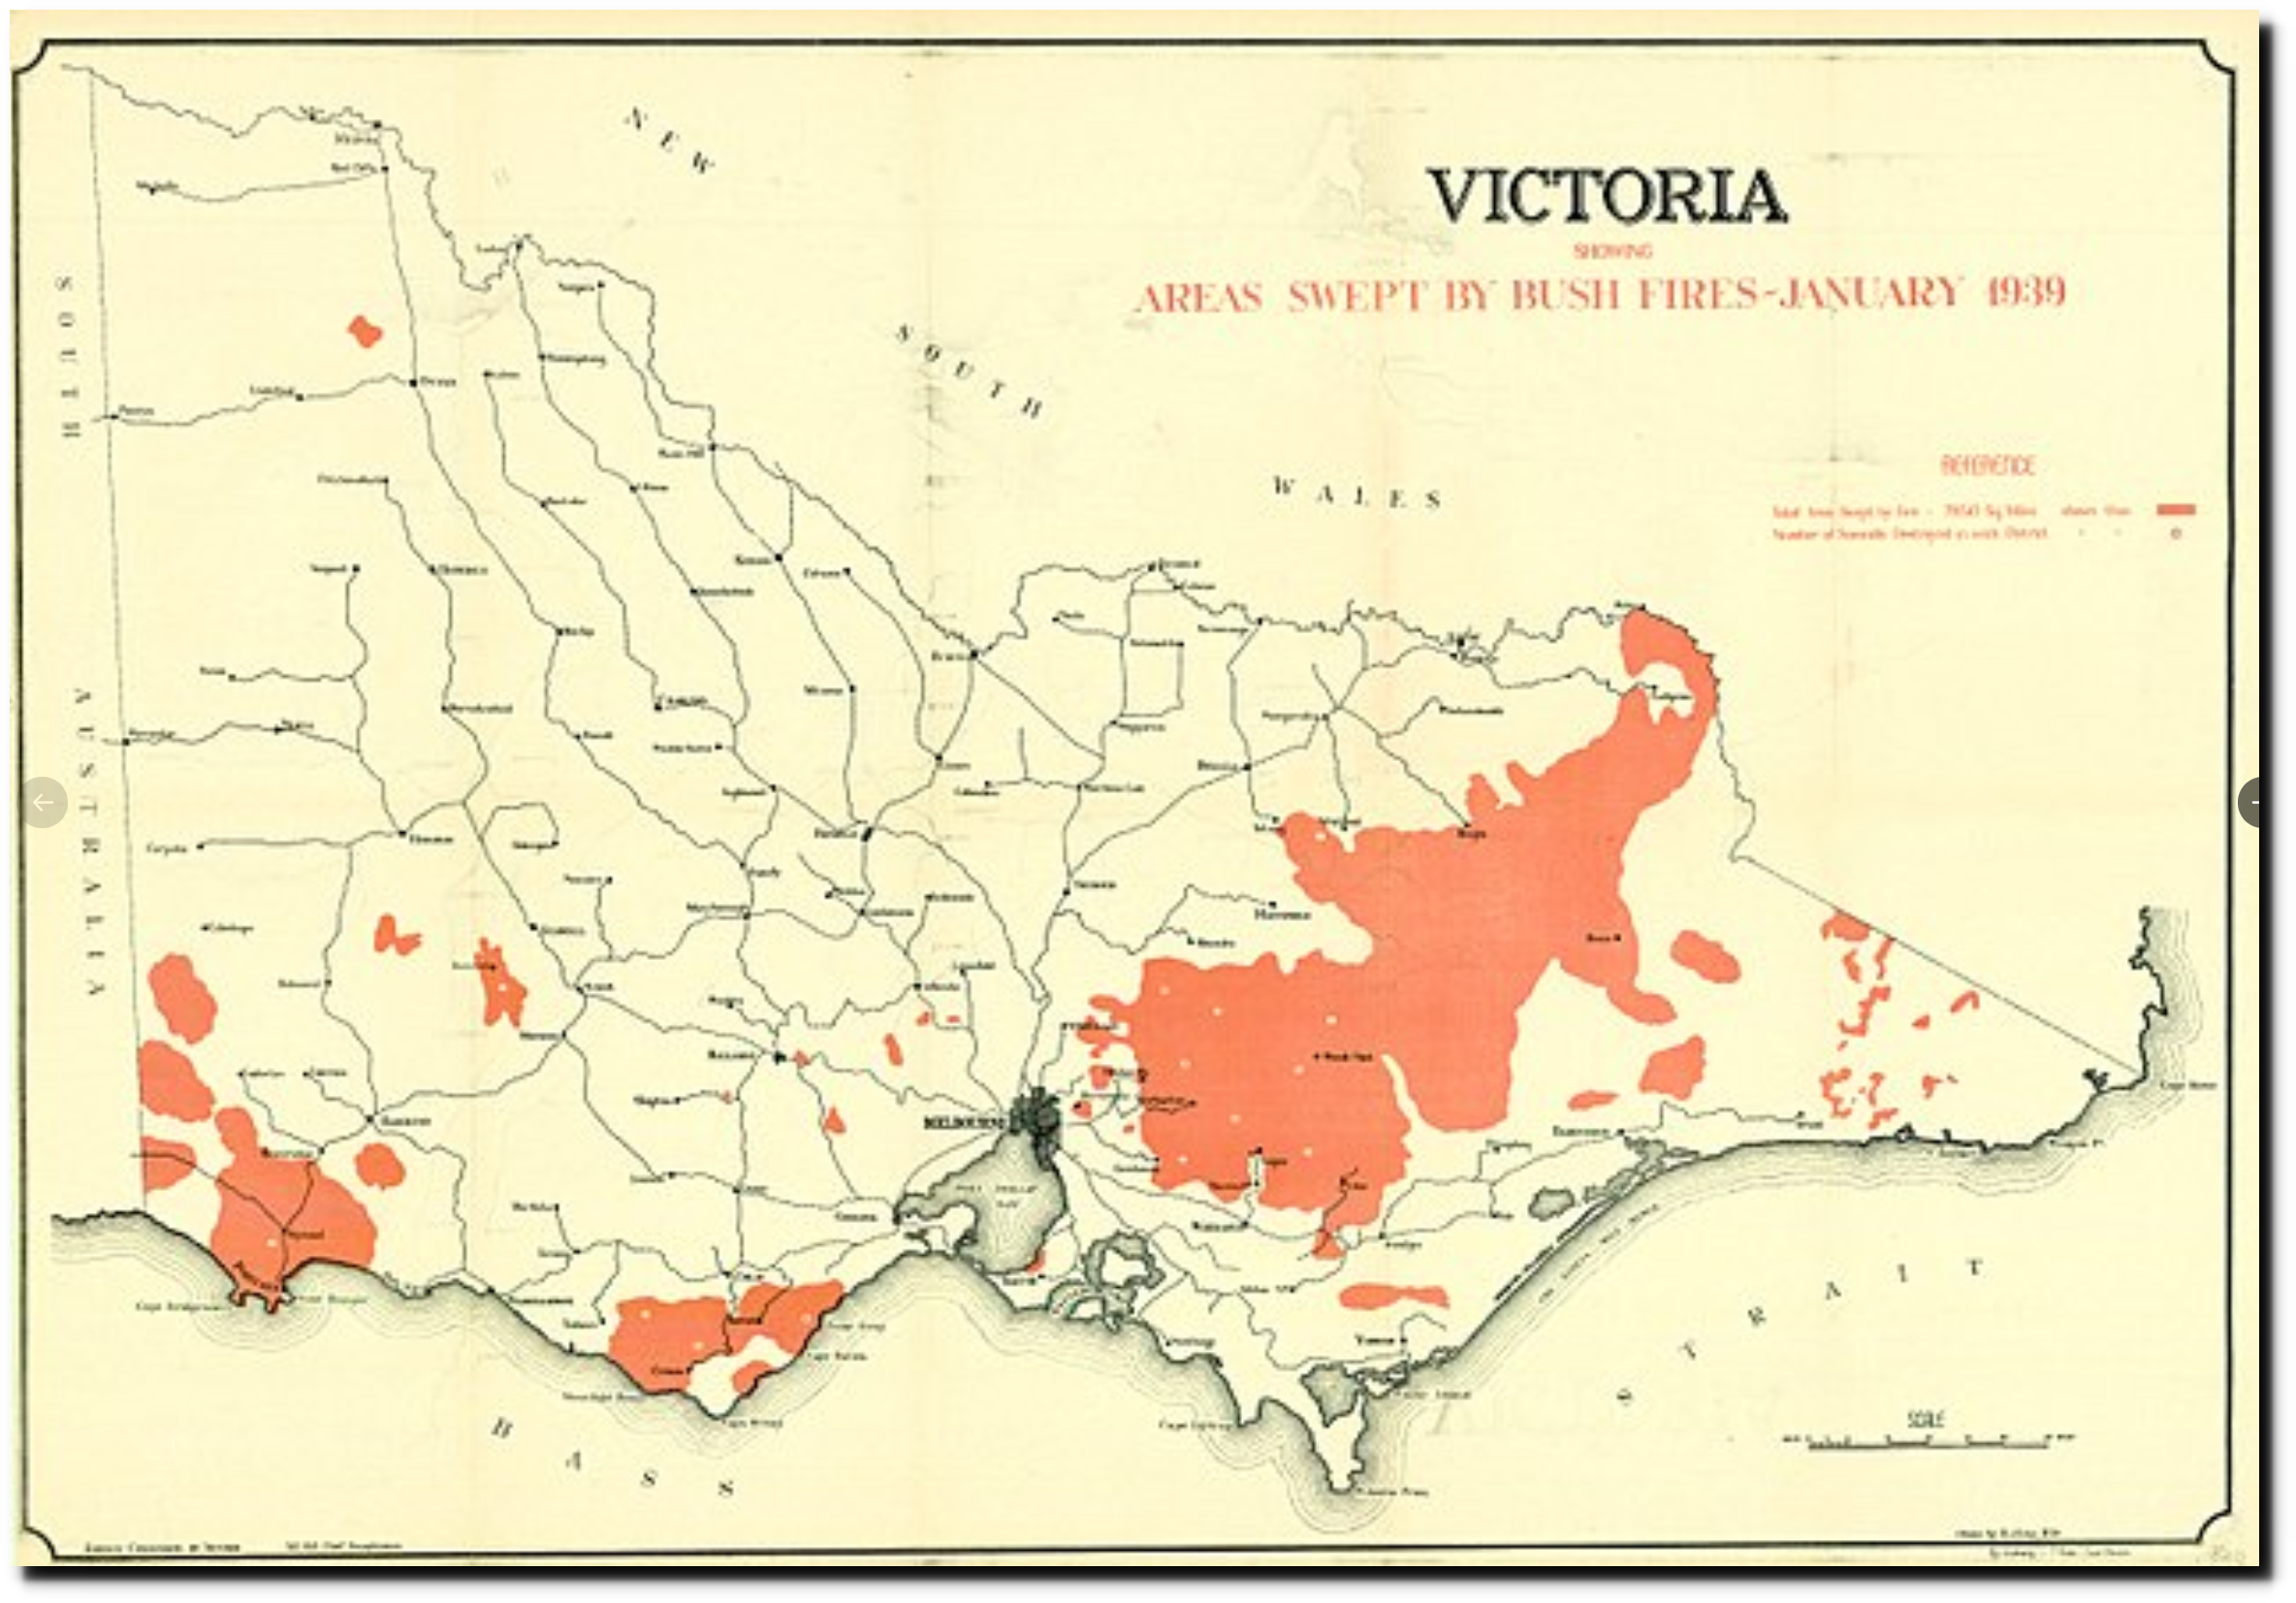
Three days later (Black Friday) Melbourne surpassed that at 114 degrees.
14 Jan 1939 – ANOTHER DAY OF INTENSE HEAT Mercury Rises to 113…
 13 Jan 1950 – Memories of Black Friday, 1939 THIS IS FRIDAY 13th
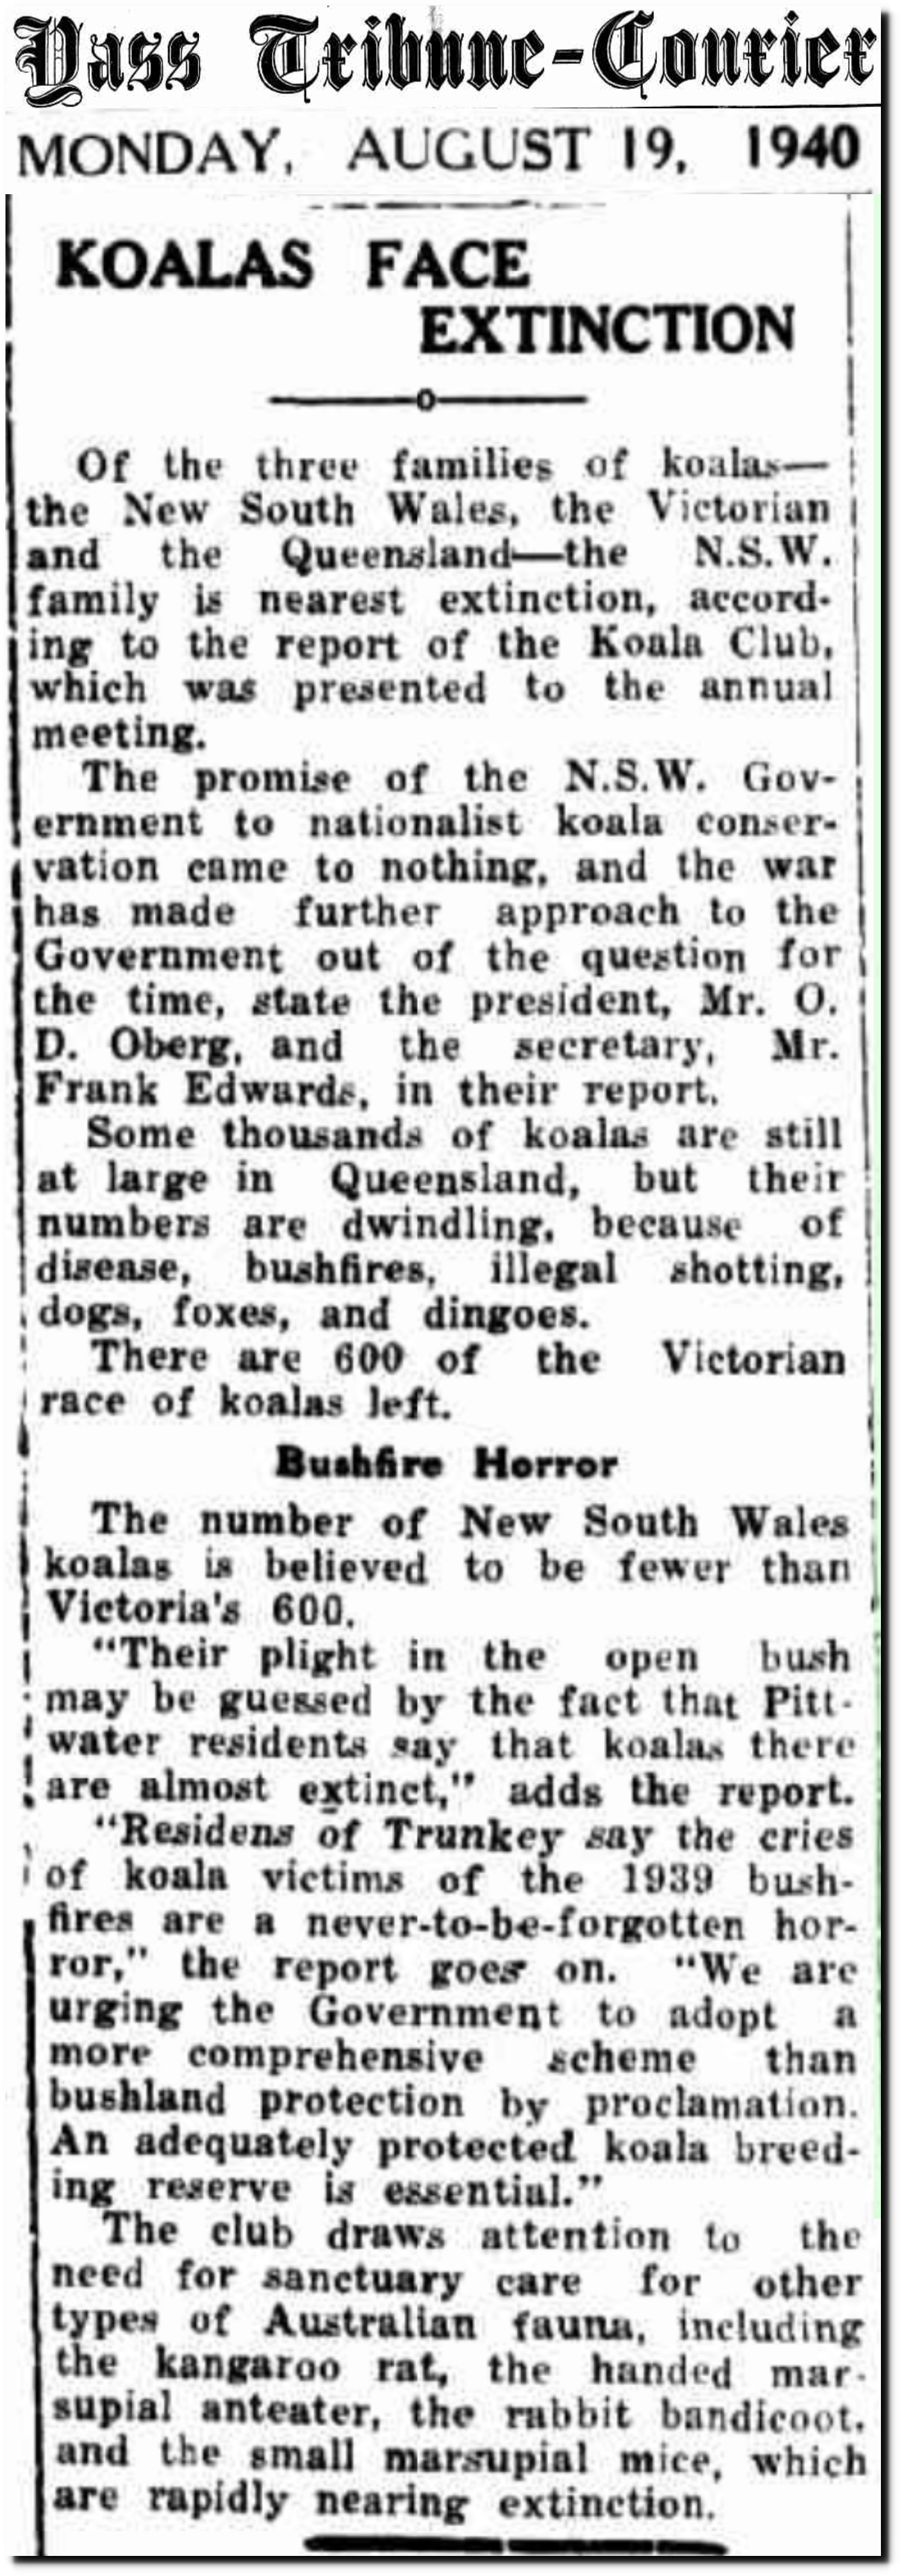
19 Aug 1940 – KOALAS FACE EXTINCTION – Trove
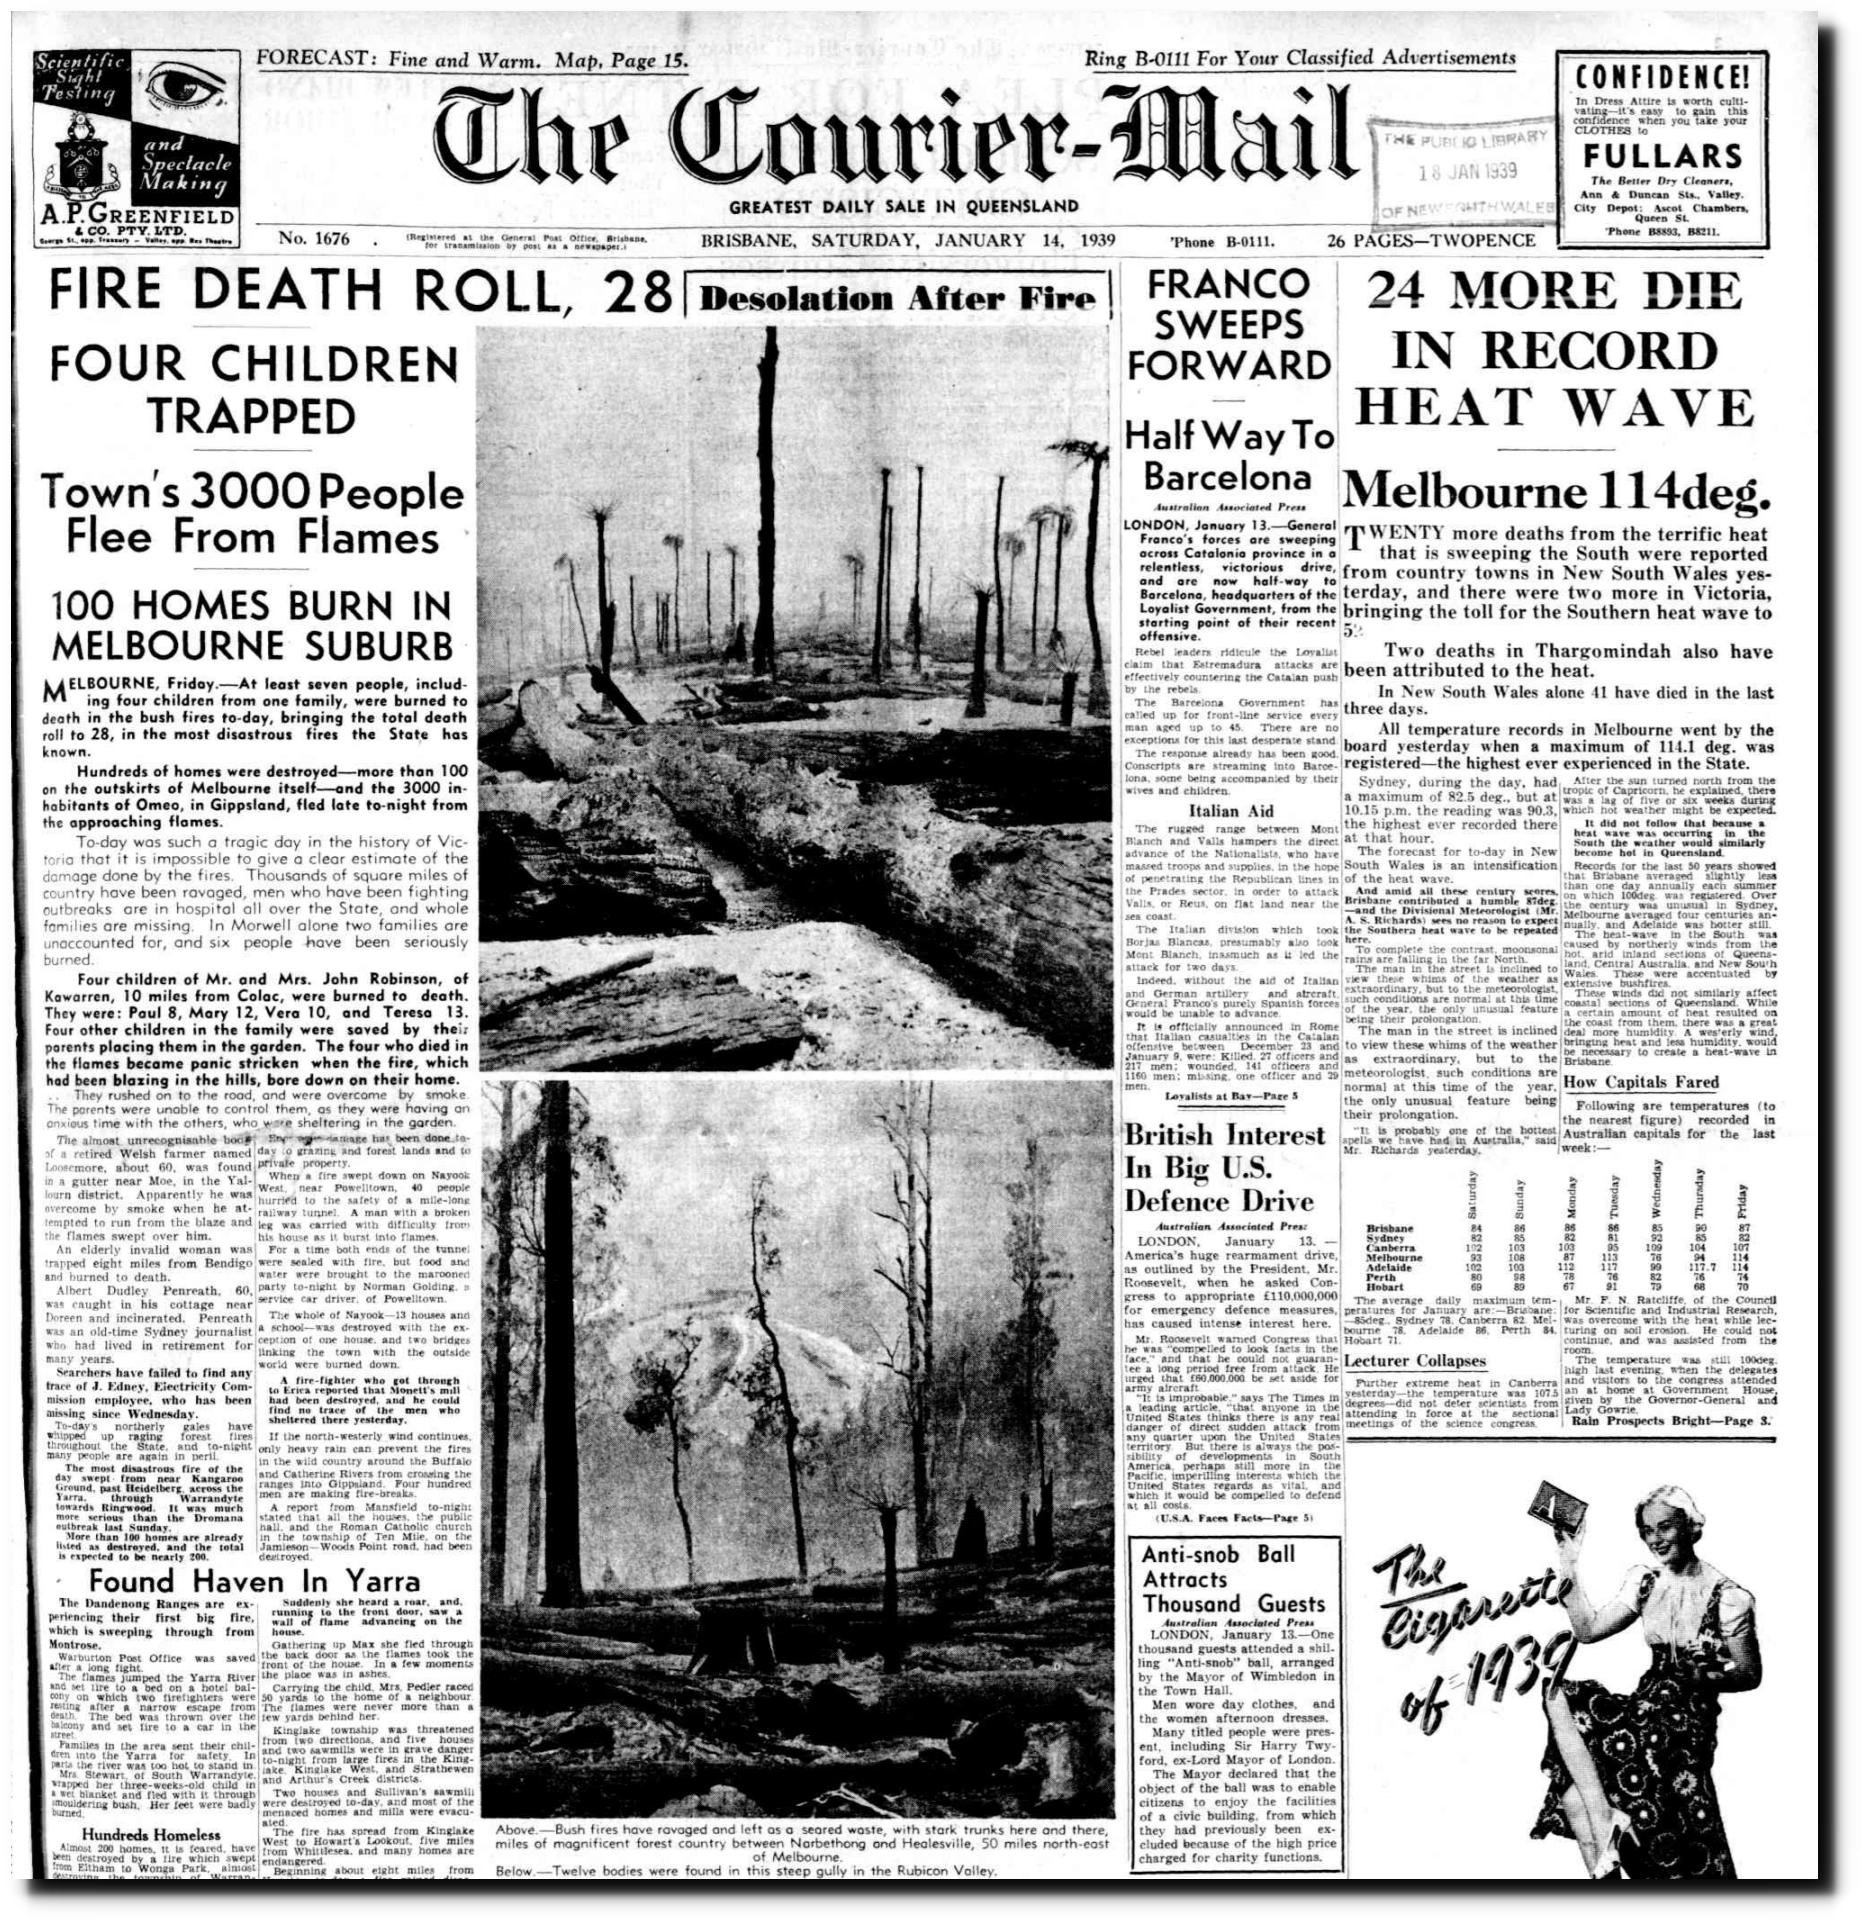
p1 – 14 Jan 1939 – The Courier-Mail (Brisbane, Qld. : 1933 – 1954) – Trove
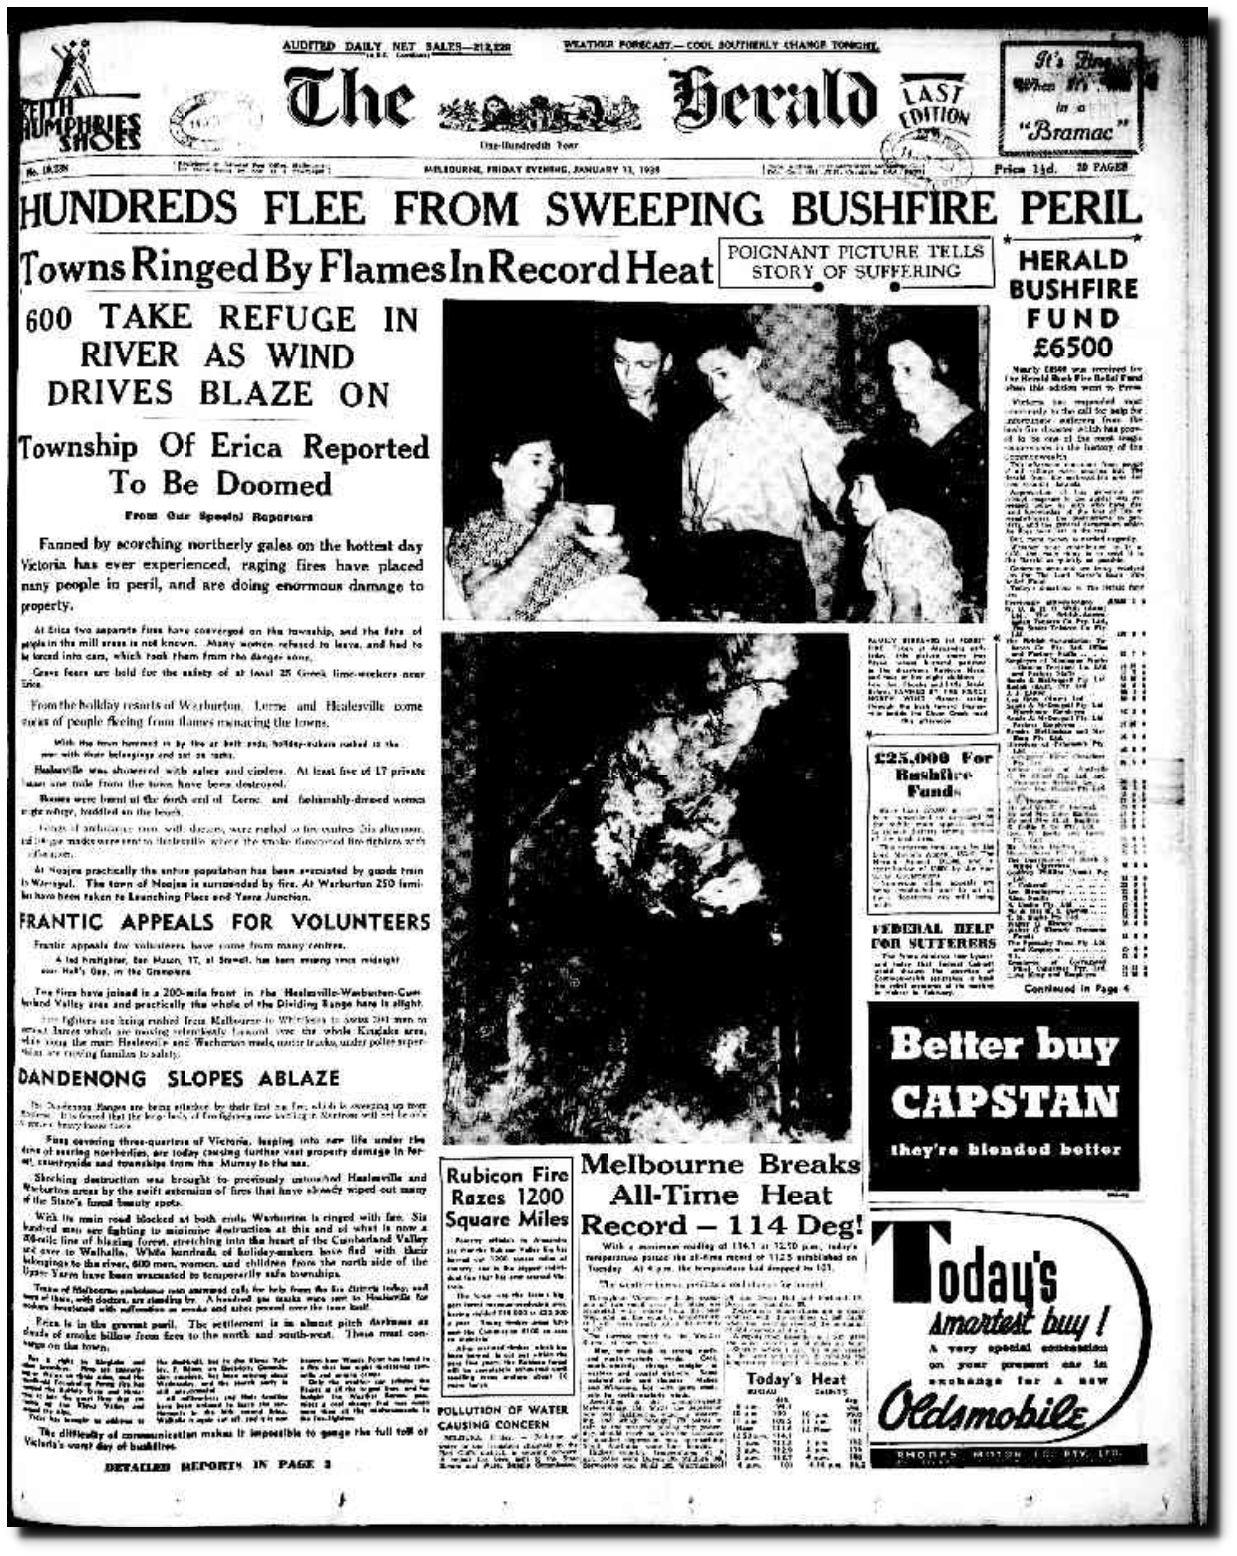
13 Jan 1939 – HUNDREDS FLEE FROM SWEEPING BUSHFIRE PERIL – Trove
The 1896 heatwave in Australia was the hotetst on record, and killed huge numbers of kangaroos, dingoes, rabbits and birds. Once again, BOM seems to believe that these animals were victims of improperly situated thermometers.
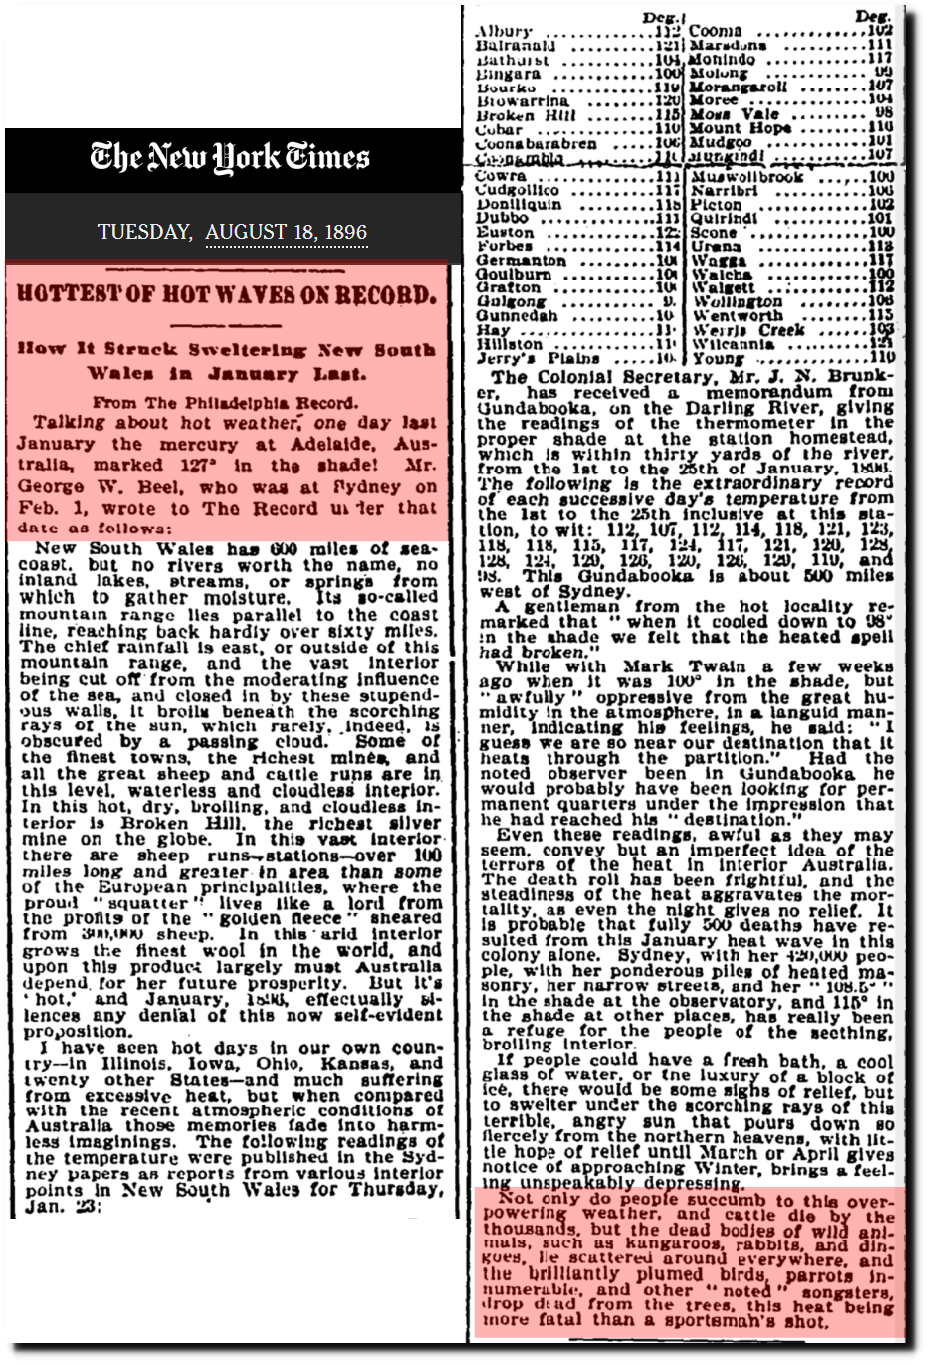
TimesMachine: August 18, 1896
Night time temperatures were extremely hot too. Apparently BOM believes these were due to thermometers in the sun at midnight.
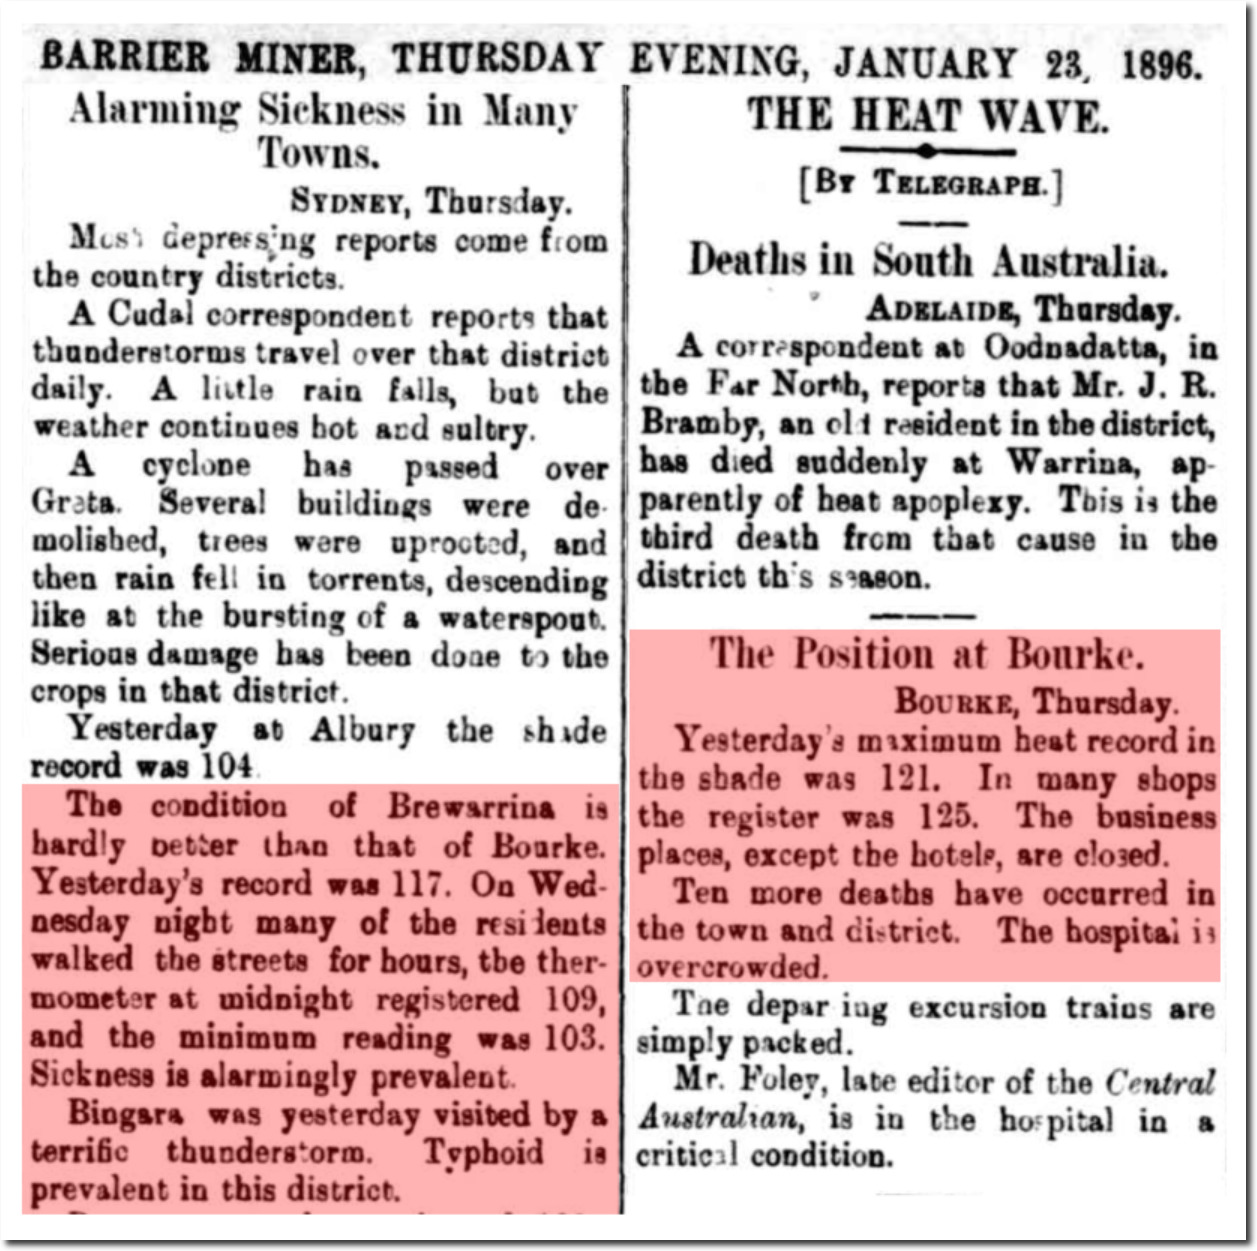

23 Jan 1896 – THE HEAT WAVE. – Trove
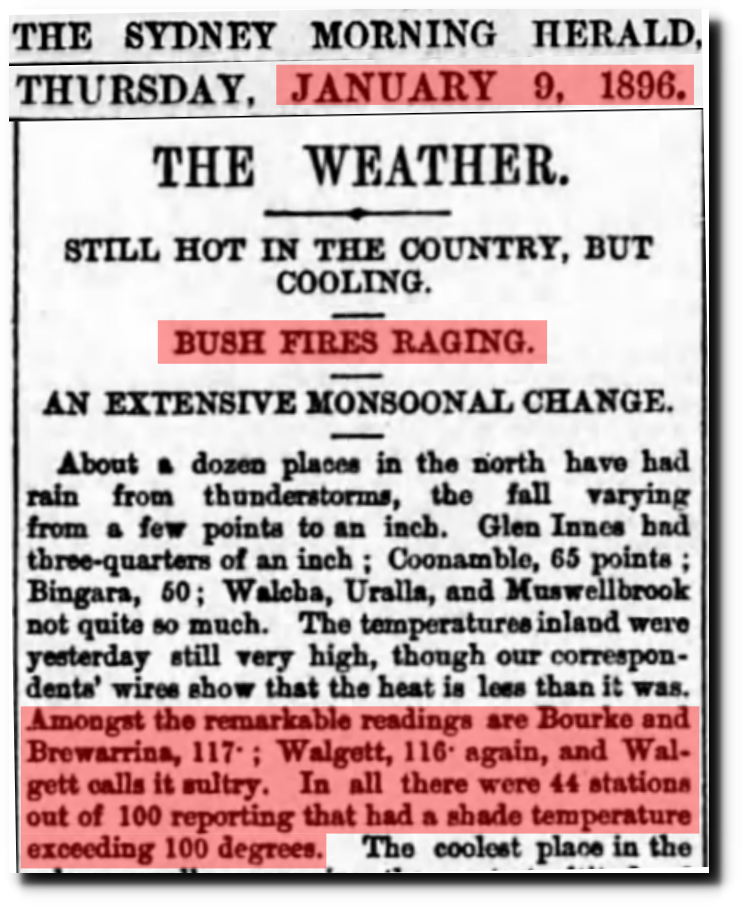
09 Jan 1896, Page 5 – The Sydney Morning Herald at Newspapers.com
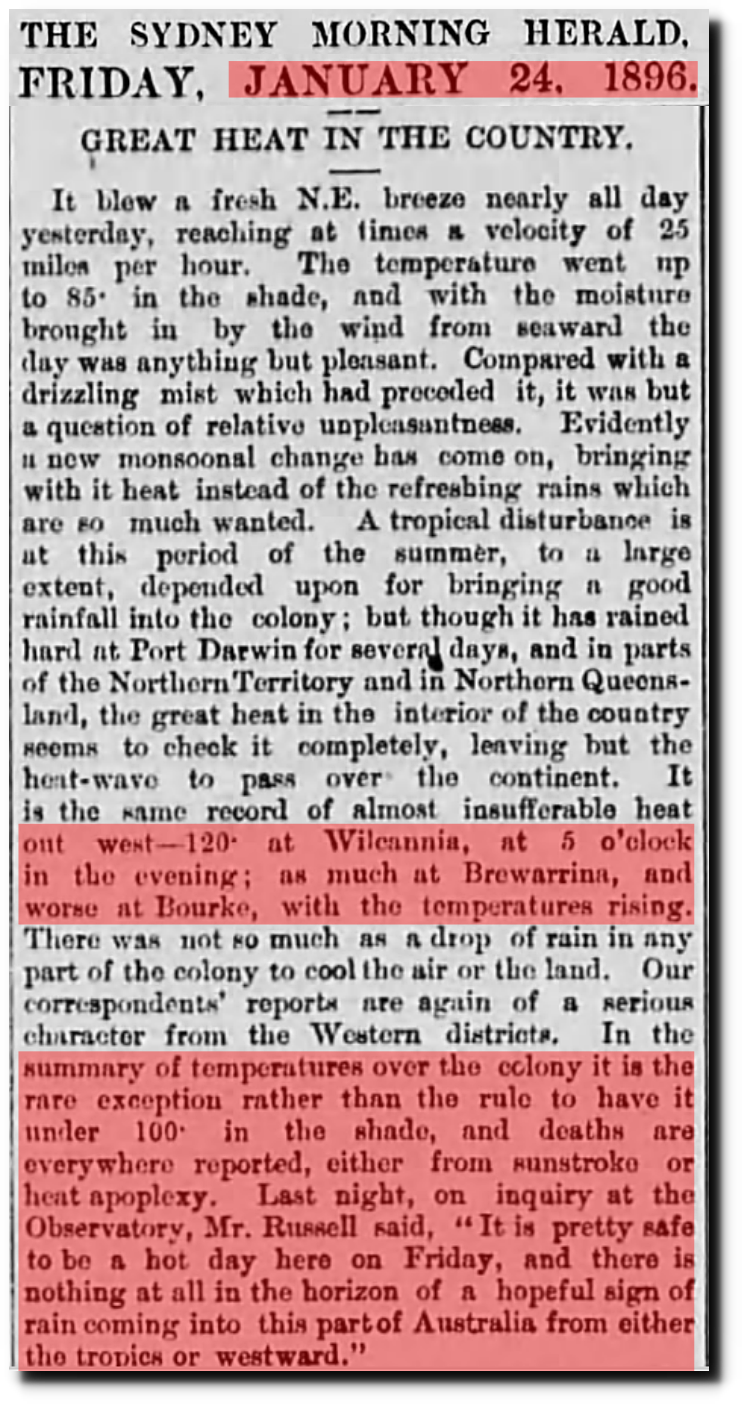
24 Jan 1896, Page 5 – The Sydney Morning Herald at Newspapers.com
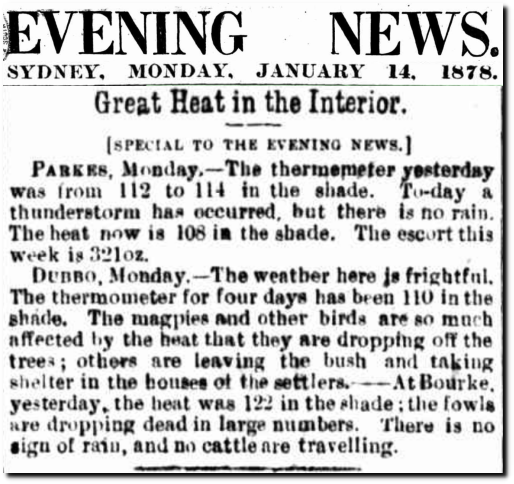
14 Jan 1878 – Great Heat in the Interior. – Trove
Minnesota had their warmest winter on record in 1878.
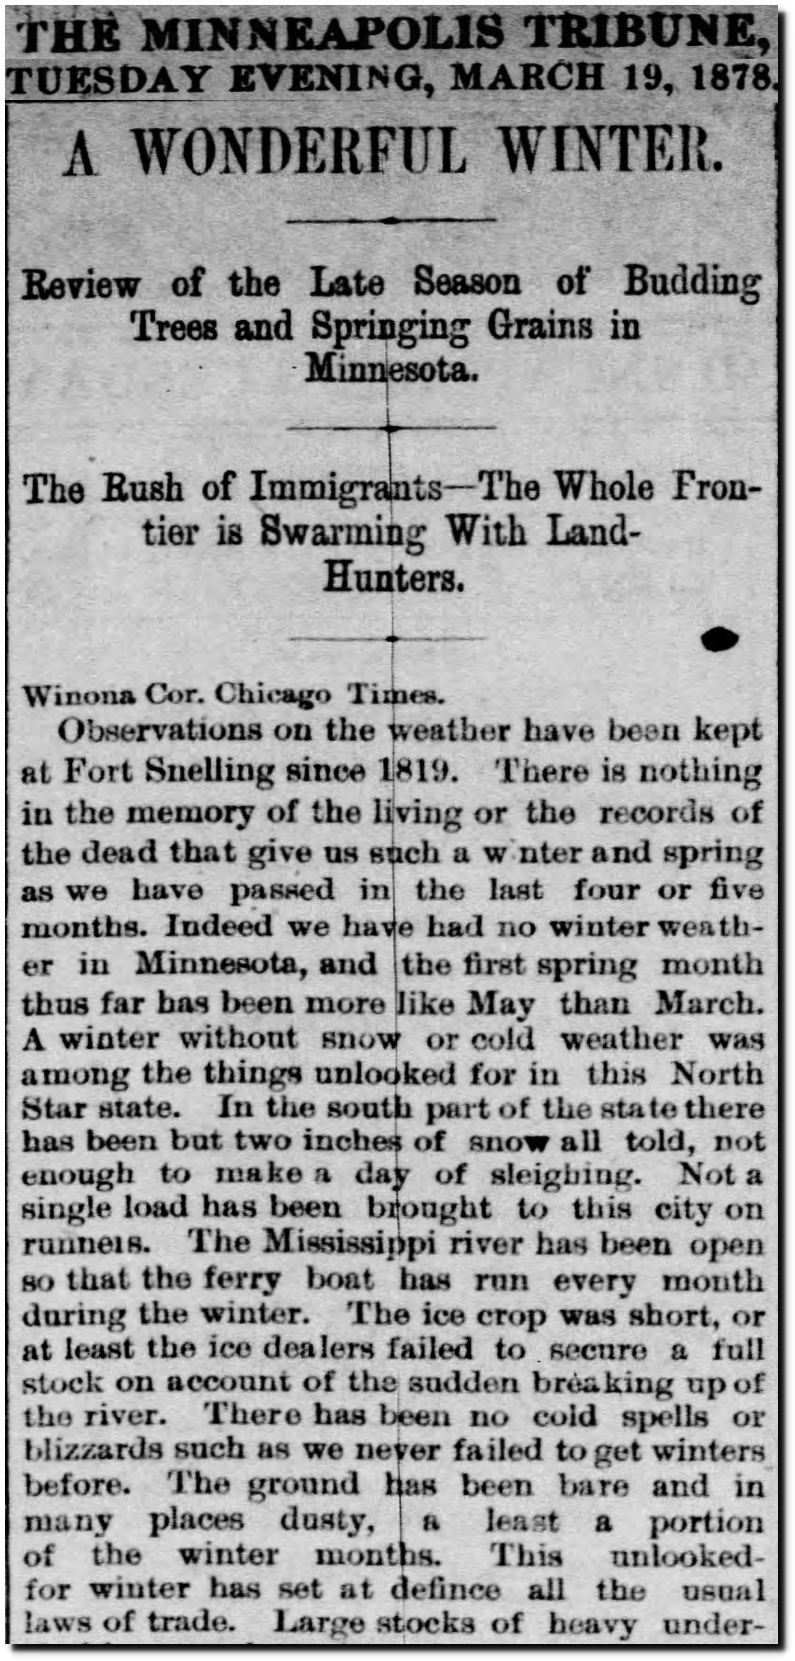
19 Mar 1878, Page 2 – Star Tribune at Newspapers.com
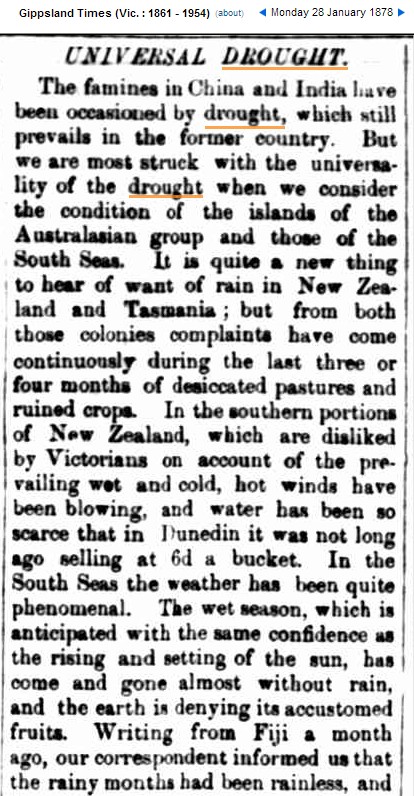
28 Jan 1878 – UNIVERSAL DROUGHT.
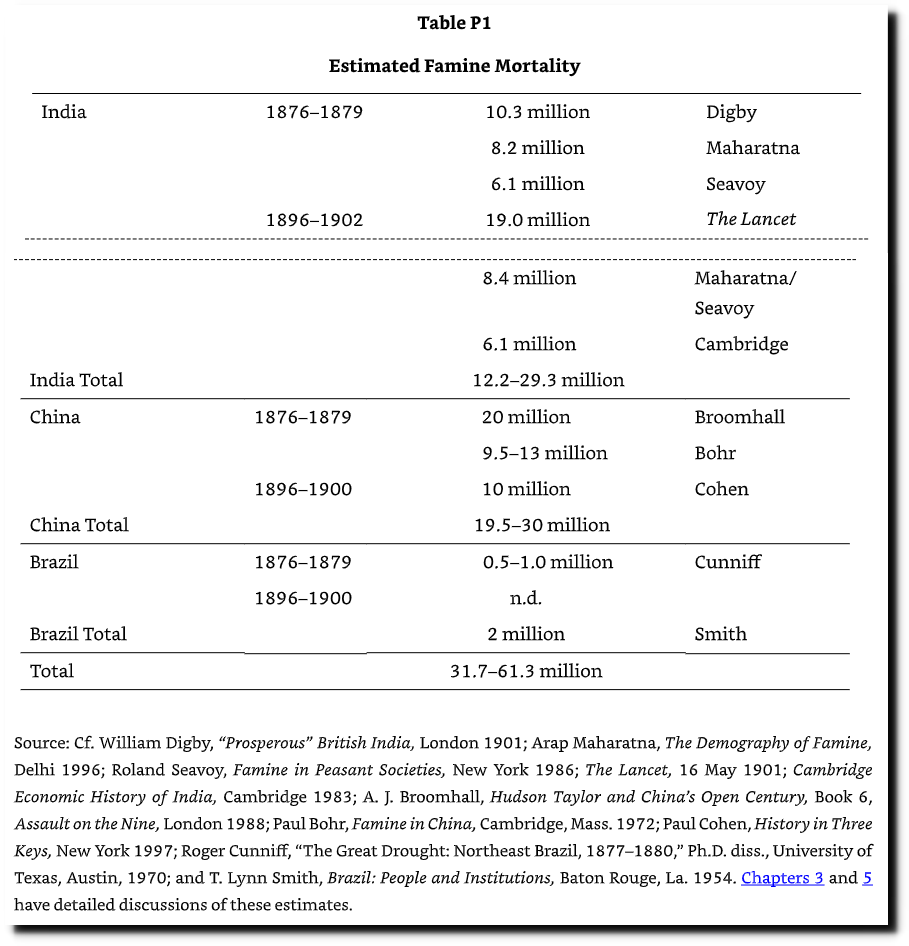
he worldwide drought and record heat of 1876-1878 killed fifty million people.
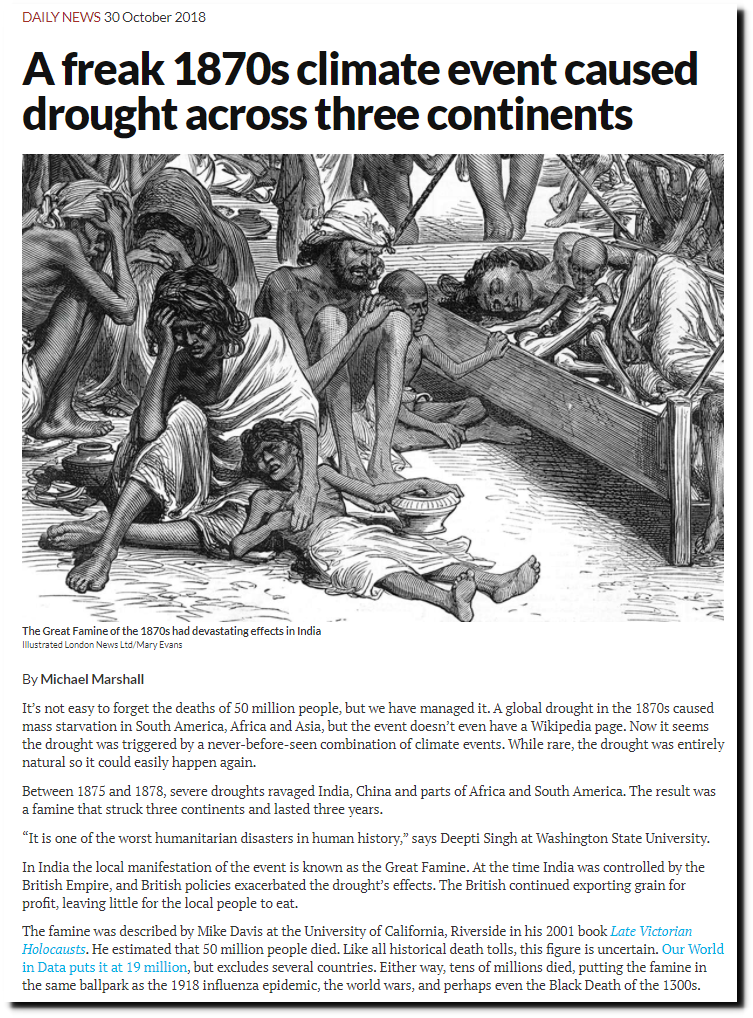
A freak 1870s climate event caused drought across three continents | New Scientist
Late Victorian Holocausts: El Niño Famines and the Making of the Third World , Davis, Mike – Amazon.com


14 Jan 1878 – Great Heat in the Interior. – Trove

31 Dec 1904 – A HEAT WAVE. – Trove