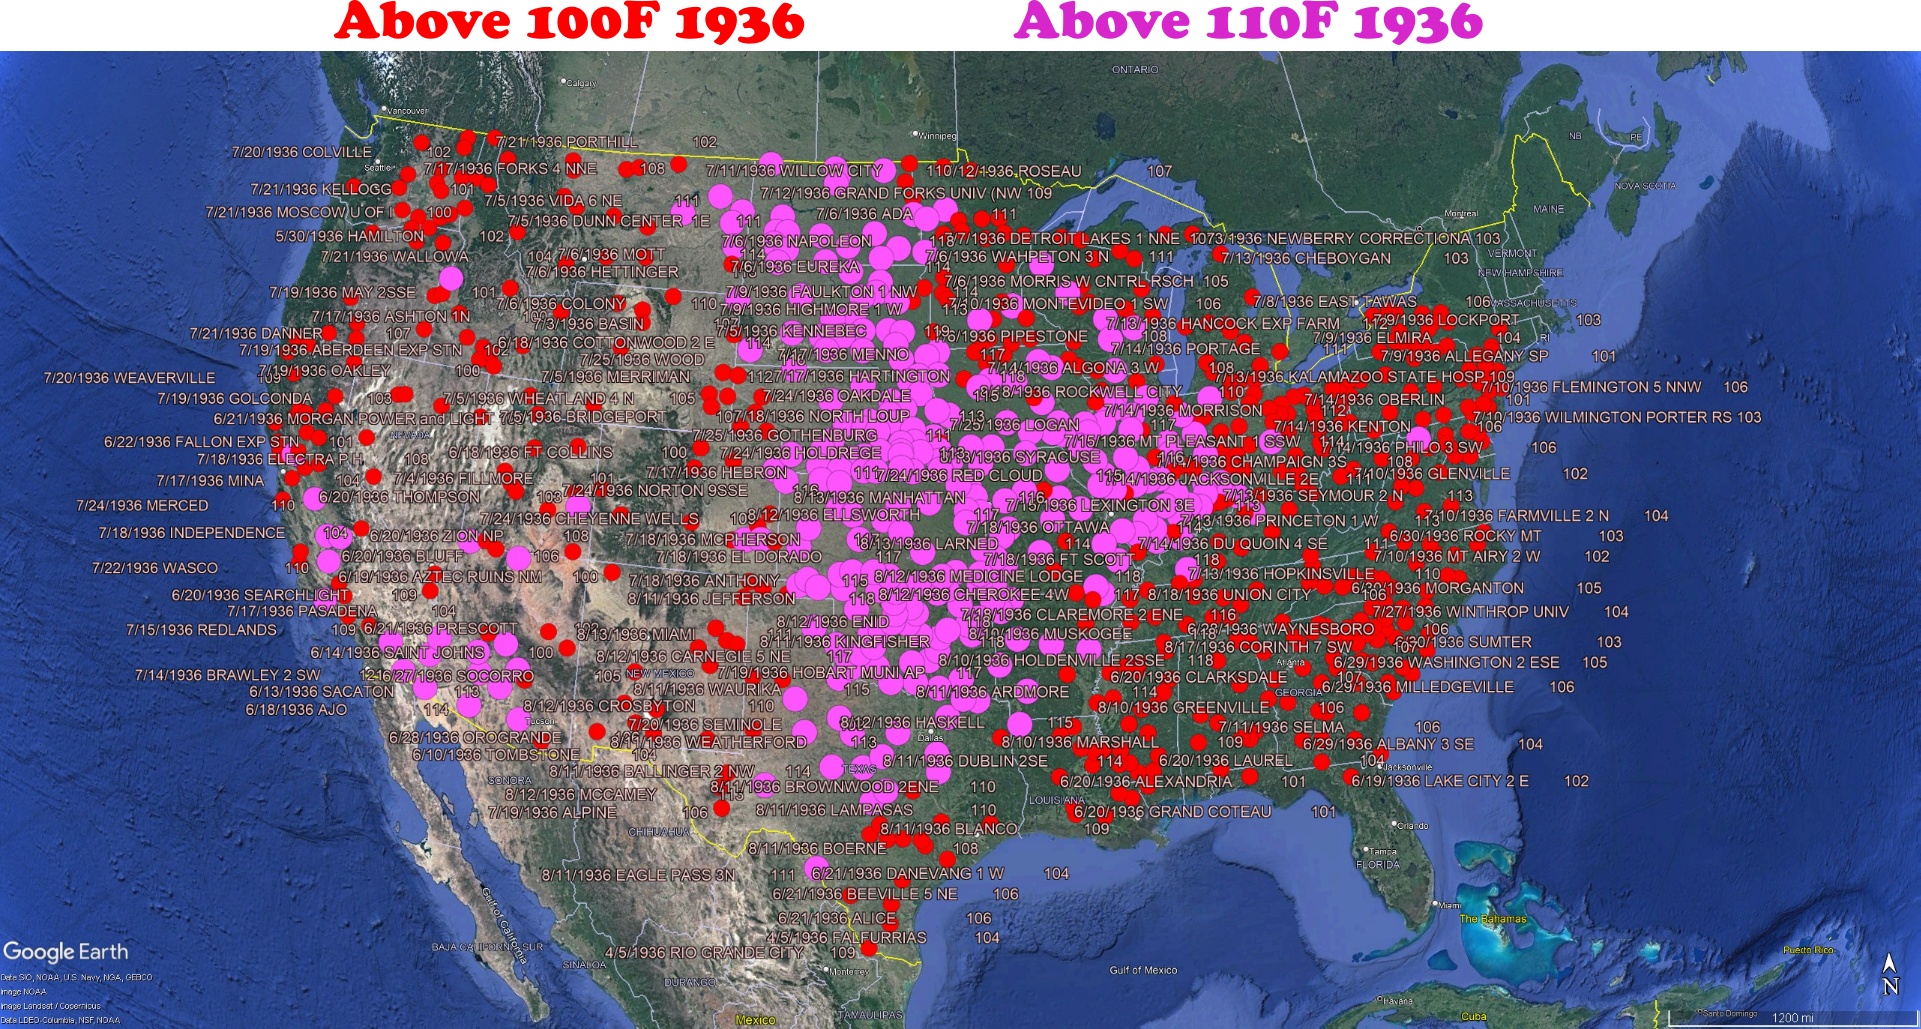
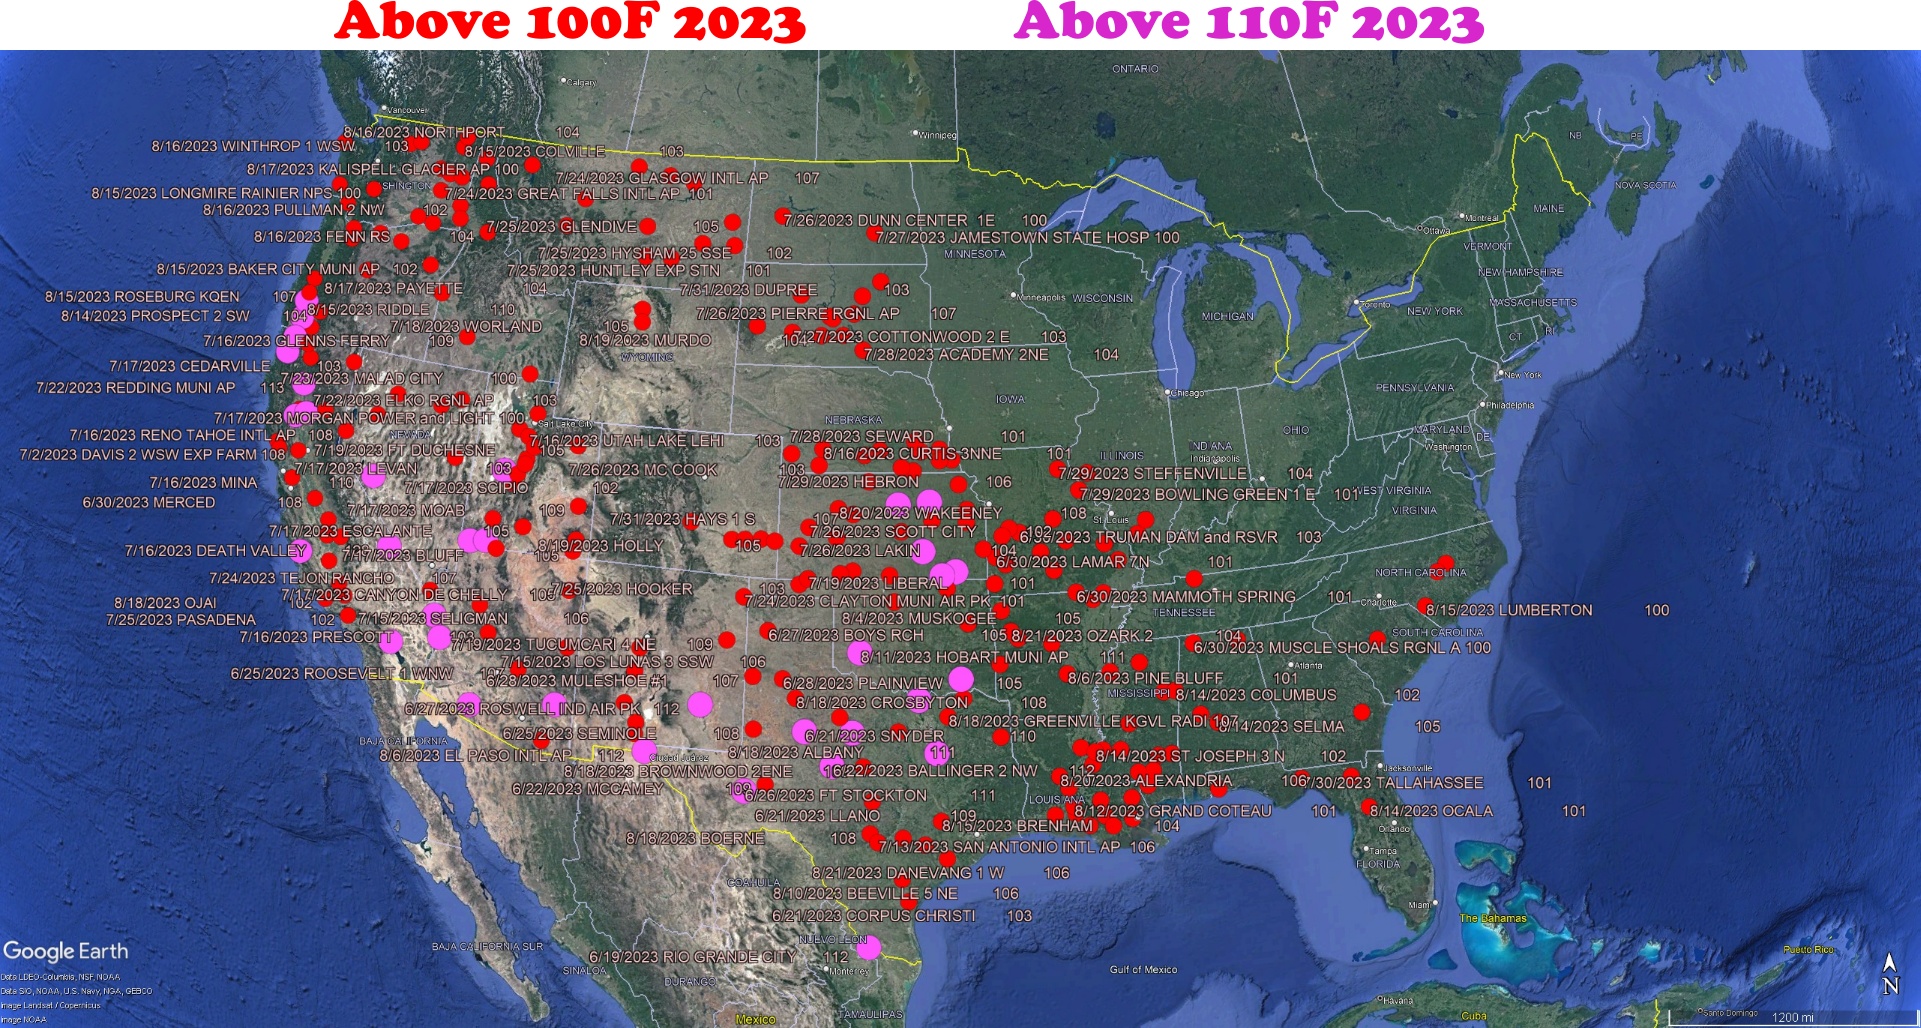
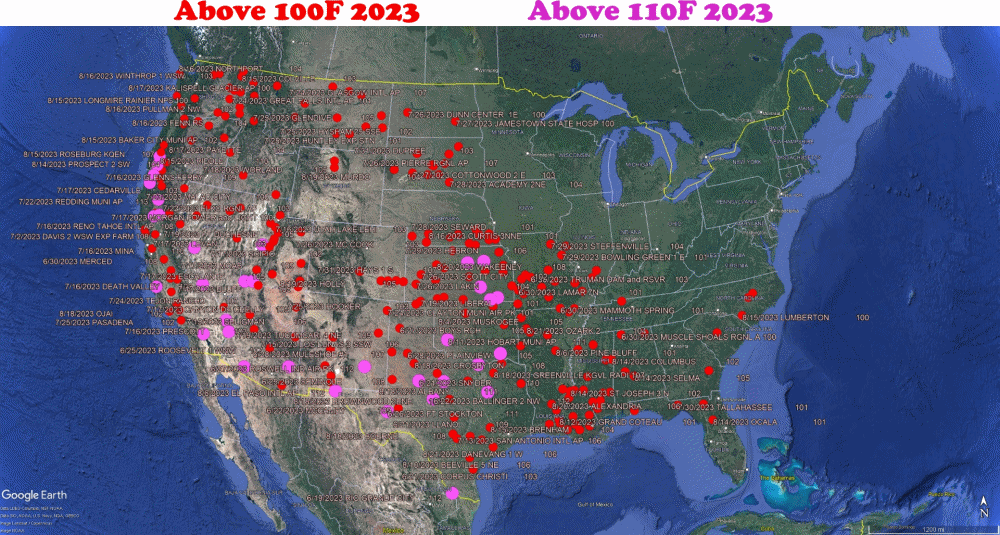
Hansen Mathematics

In 1988, James Hansen predicted a large increase in the frequency of droughts since the 1950s, when he said the odds were one in twenty.

“Dr. James E. Hansen, director of the Goddard Institute for Space Studies, who presented recent data compiled from computer models, said that predicted regional effects of global warming show that the chances of summer drought in the low and middle latitudes would be 1 in 3 by the year 2030, as against 1 in 20 in the 1950’s.”

FEROCIOUS STORMS AND DROUGHT SEEN – The New York Times

Droughts in the US have been becoming less frequent, and Hansen was off by a factor of ten about the 1950s, which were in drought more than half the time.

National Time Series | Climate at a Glance | National Centers for Environmental Information (NCEI)

There was a severe drought in 1900-1901 which NOAA seems to have lost track of.

“The present drought Is following the same general trend and so far there is a striking similarity between the two. Both started early in the year, went through an extremely dry summer, were broken temporarily by a single month of abnormal fall of rain and were followed immediately by months far drier than those that had gone before.

Twelve of these dry months followed the 1900 “break.” Four al- ready have followed the “break” of last fall, with the fifth just starting.

The 1900-01 drought started in January, 1900. The total rainfall that year was 27.78 inches, three inches more than tn 1930, making it comparable. The normal rain- fall is 38.55 inches.

In the summer of 1900 a serious drought was followed by a 4.5-inch November rain, 63 per cent above that month’s normal rainfall, This temporary breaking of the drought was followed immediately by a 1.01-Inch rain in December and 11 more months of extreme dryness, which set up a 12 months’ record that has never been equaled, From December, 1900, to November, 1901, the 12 months’ rainfall was only 15.63 inches. In December that year an abnormal rain ended the drought and gave a total rainfall for the year of 17.99 inches, the record full year,”

08 Feb 1931, 36 – The Cincinnati Enquirer at Newspapers.com

Posted in Uncategorized | Leave a comment

Creating Hysteria Through Fake News

Reuters is reporting unprecedented heat in Iran. Both Iran and the US were much hotter seventy years ago in 1953.

Iran shuts down for two days due to extreme heat

“IN Iran the thermometer hit 129 degrees and 180 persons died of the heat”

19 Aug 1953, Page 2 – The Akron Beacon Journal at Newspapers.com

Extreme Weather – Google Books

Posted in Uncategorized | Leave a comment

Creating A Fake Temperature Trend

Measured US afternoon temperatures have declined about one degree over the past century.

ftp://ftp.ncdc.noaa.gov/pub/data/ghcn/daily/ghcnd_hcn.tar.gz

But NOAA shows about three degrees warming in the graphs they release to the public.

National Time Series | Climate at a Glance | National Centers for Environmental Information (NCEI)

They do this by altering the data in their adjusted monthly data set.

ftp://ftp.ncdc.noaa.gov/pub/data/ushcn/v2.5/ushcn.tmax.latest.FLs.52j.tar.gz

ftp://ftp.ncdc.noaa.gov/pub/data/ushcn/v2.5/ushcn.tmax.latest.raw.tar.gz
ftp://ftp.ncdc.noaa.gov/pub/data/ushcn/v2.5/ushcn.tmax.latest.FLs.52j.tar.gz

Older temperatures are cooled about 1,5F and recent temperatures are being warmed by similar amount.

A small part of the adjustment is Time Of Observation Bias.

Most of the data tampering is being done by fabricating temperatures at stations where they have no thermometer readings. NOAA has been losing stations very rapidly since 1989

In their final adjusted data set they create fake temperatures for stations with no data, which is almost half of the stations.

The fabricated temperatures have more than three degrees warming, which accounts for almost all of the adjusted temperature rise.

US temperatures are very important, because most of the world has little or no high quality long-term temperature data.

ftp://ftp.ncdc.noaa.gov/pub/data/ghcn/daily/figures/station-counts-1891-1920-temp.png

Posted in Uncategorized | Leave a comment

Climate Fakery Part 19

NOAA and NASA have altered the US temperature data to turn a long-term cooling trend into a warming trend. In this video I explain the data tampering being done to hide the decline in US temperatures.

Posted in Uncategorized | Leave a comment

Unprecedented Fake News

The usual perpetrators of the climate scam are claiming unprecedented ocean temperatures for a thermometer reading which was neither in the ocean nor unusual for that location.

10:30 AM · Jul 31, 2023

Florida ocean records ‘unprecedented’ temperatures similar to a hot tub | Florida | The Guardian

“It’s not even the record for Manatee Bay, the observing site where the data came from, said David Zierden, state climatologist at the Florida Climate Center in Tallahassee.

“I would not consider them a “sea surface temperature,” as that implies open ocean.”

Record water temperatures in Florida not unprecedented

Posted in Uncategorized | Leave a comment

Drilling To Net Zero

“The UK government said Monday it would issue “hundreds” of new oil and gas licences in the North Sea to secure energy reserves while still aiming for net zero carbon emissions by 2050.”

UK to issue ‘hundreds’ of new oil, gas licences in North Sea

Posted in Uncategorized | Leave a comment

Climate Fakery Part 18

NASA climate scientist Peter Kalmus says Biden should declare a “climate emergency.” He is using the good reputation of NASA to spread misinformation and baseless hysteria.

Posted in Uncategorized | Leave a comment

Hot Summers From The Past

The percent of USHCN stations to have reached 100F so far this year (25%) is sixth lowest on record. Average since 1895 is 43%.

Posted in Uncategorized | Leave a comment

NASA : Biden Must Declare A Climate Emergency

During the 2020 election campaign, Joe Biden guaranteed he would end fossil fuels.

NASA climate scientist Peter Kalmus says that unless Joe Biden ends fossil fuels, he will continue to suffer bottomless grief.

Joe Biden must declare a climate emergency. And he must do so now | Peter Kalmus | The Guardian

Forest fire burn acreage in the US is at historically low levels, down more than 99% since pre-industrial times.

National Fire News | National Interagency Fire Center

“In the conterminous United States during the preindustrial period (1500- 1800), an average of 145 million acres burned annually. Today only 14 million acres (federal and non-federal) are burned annually by wildland fire from all ignition sources.”

Wayback Machine

The percent of the US to have reached 95F (35C) so far this year is at a record low.

The summer of 1936 was much hotter.

July 29 Arctic sea ice extent is the highest in seventeen years, and there has been no trend over that period.

ftp://osisaf.met.no/prod_test/ice/index/v2p1/nh/osisaf_nh_sie_daily.txt
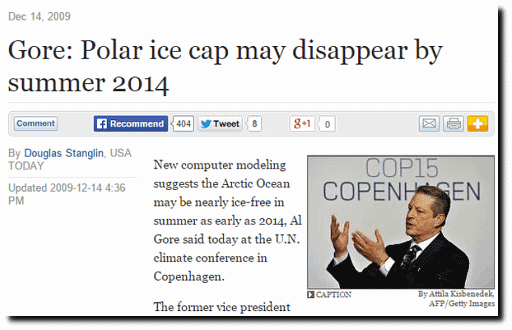
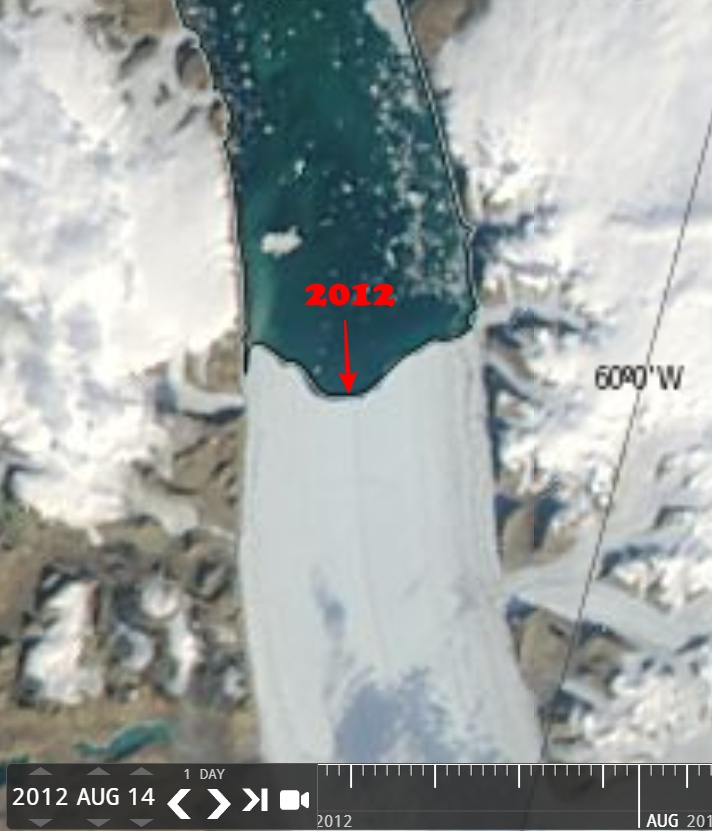
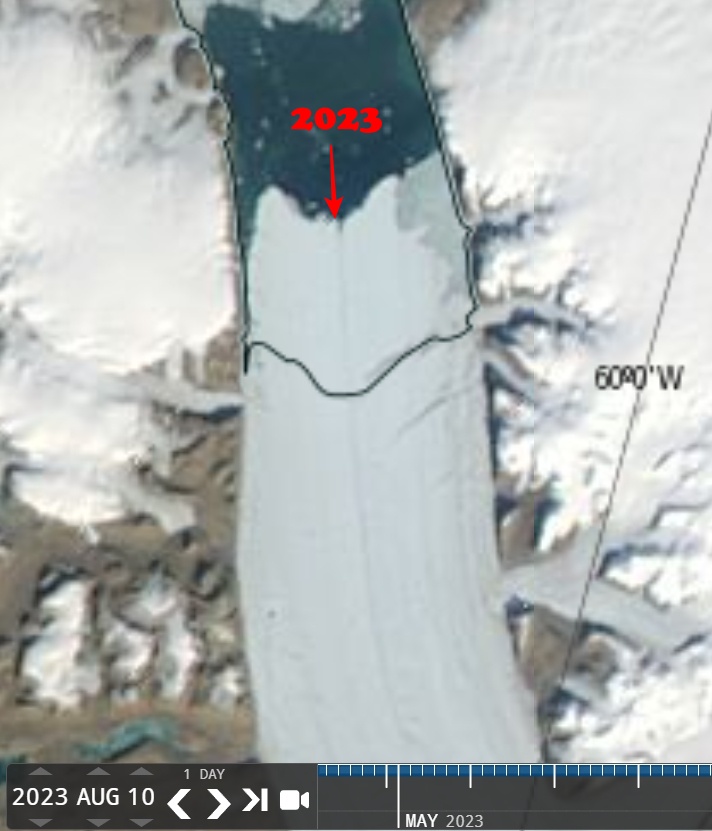
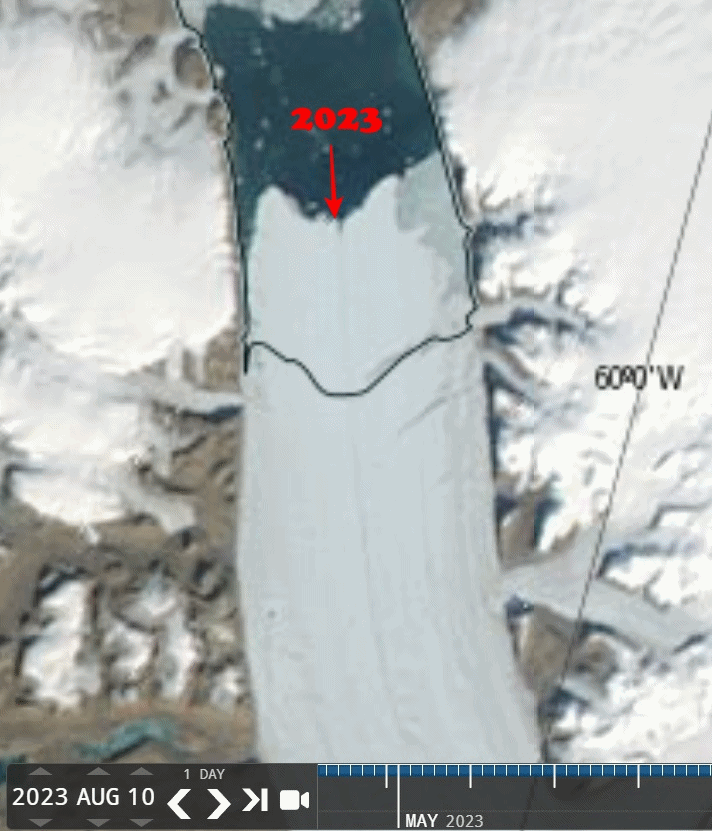
The surface of the Greenland Ice Sheet has gained 450 billion tons of ice over the last eleven months.  Five of the last seven years have had ice gains greater than the 1981-2010 average.

Surface Conditions: Polar Portal

Fossil fuel usage is skyrocketing around the world.

Global primary energy consumption by source

The US doesn’t control CO2 emissions and there is nothing Biden could do change the trajectory of CO2 growth.

Annual CO? emissions

Global Monitoring Laboratory – Carbon Cycle Greenhouse Gases

Posted in Uncategorized | Leave a comment

UN : Asia Warming Faster Than Rest Of Planet

The UN says Asia, like every place else in the world, is warming faster than the rest of the planet.

2:42 PM · Jul 29, 2023

Posted in Uncategorized | Leave a comment