
Measured US afternoon temperatures have declined about one degree over the past century.
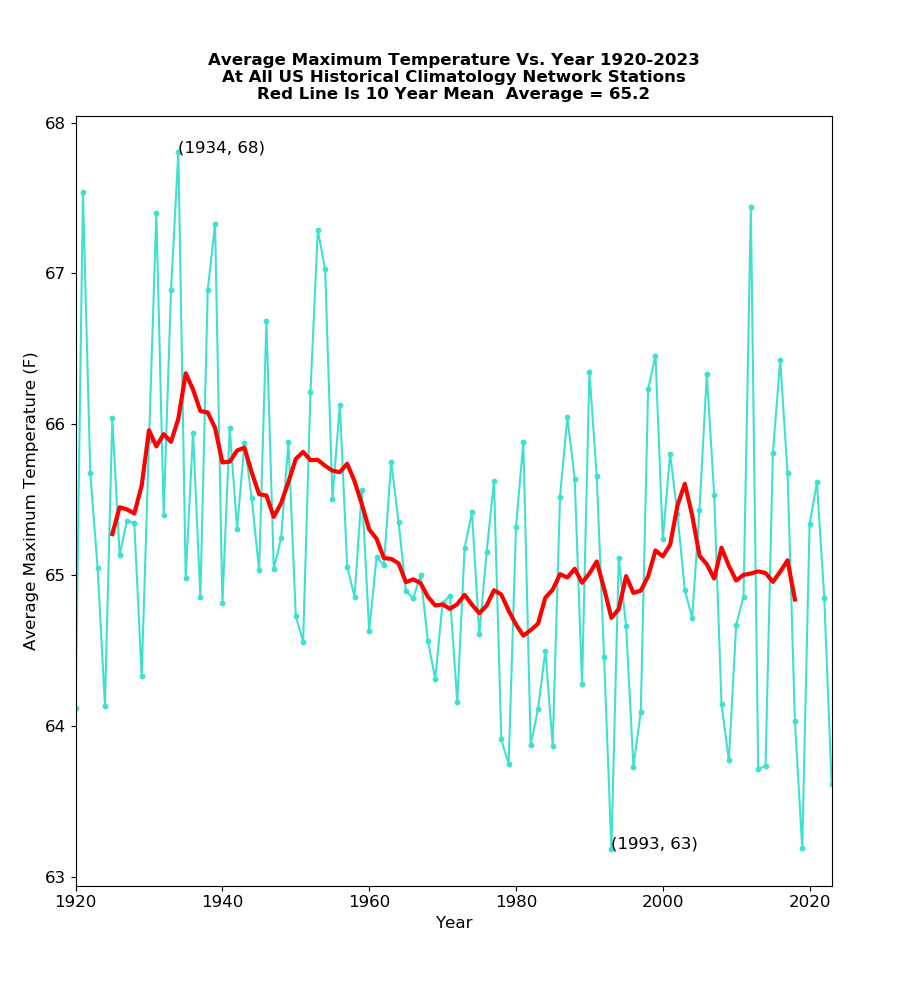
ftp://ftp.ncdc.noaa.gov/pub/data/ghcn/daily/ghcnd_hcn.tar.gz
But NOAA shows about three degrees warming in the graphs they release to the public.
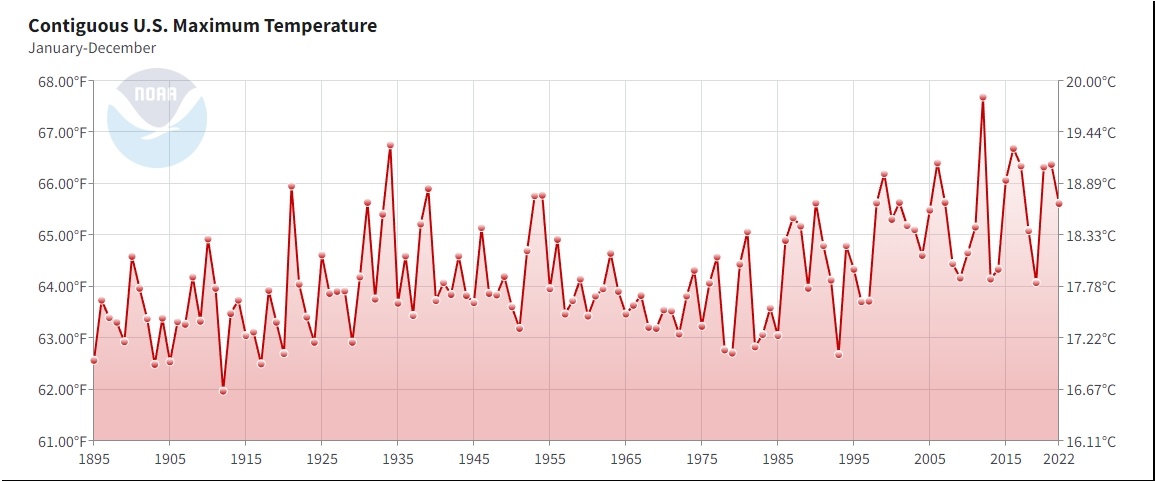
National Time Series | Climate at a Glance | National Centers for Environmental Information (NCEI)
They do this by altering the data in their adjusted monthly data set.
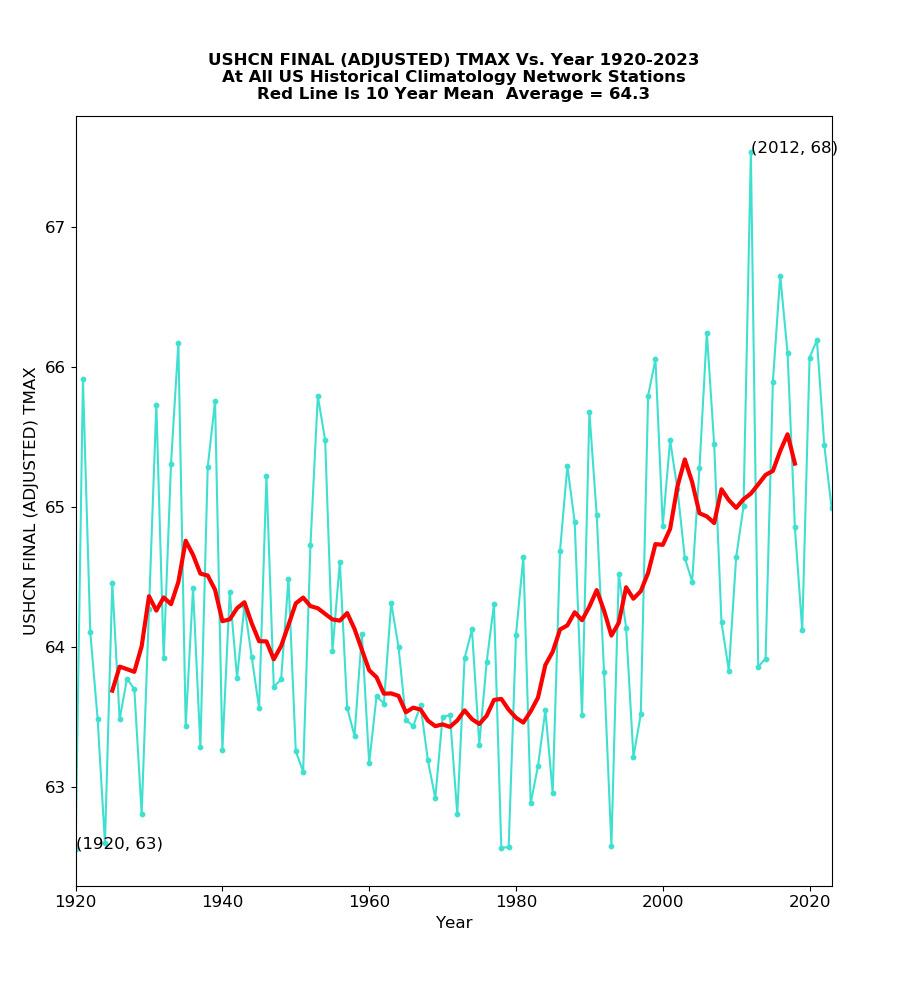
ftp://ftp.ncdc.noaa.gov/pub/data/ushcn/v2.5/ushcn.tmax.latest.FLs.52j.tar.gz
ftp://ftp.ncdc.noaa.gov/pub/data/ushcn/v2.5/ushcn.tmax.latest.raw.tar.gz
ftp://ftp.ncdc.noaa.gov/pub/data/ushcn/v2.5/ushcn.tmax.latest.FLs.52j.tar.gz
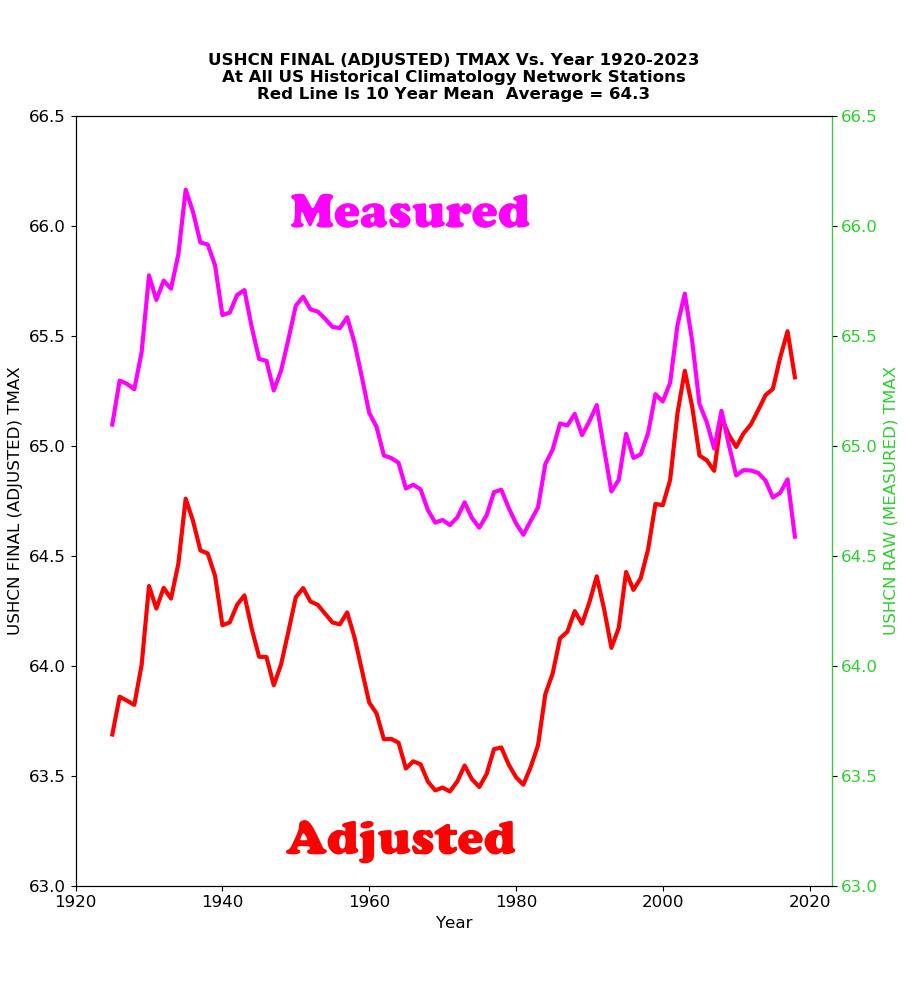
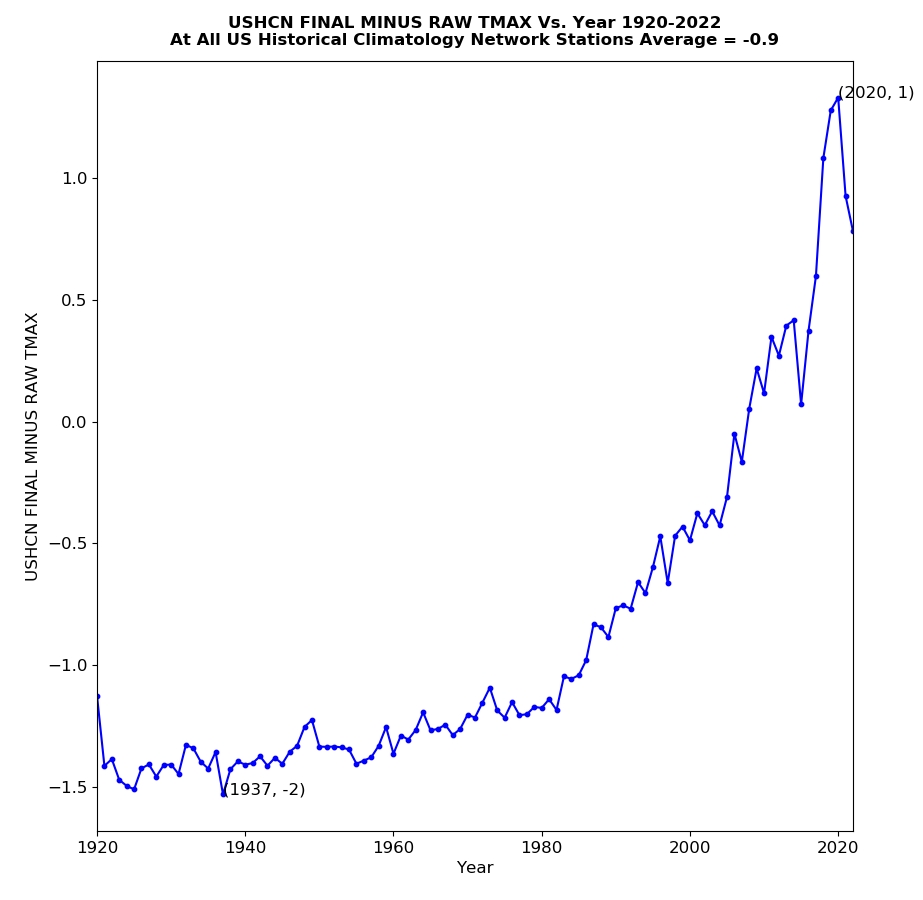
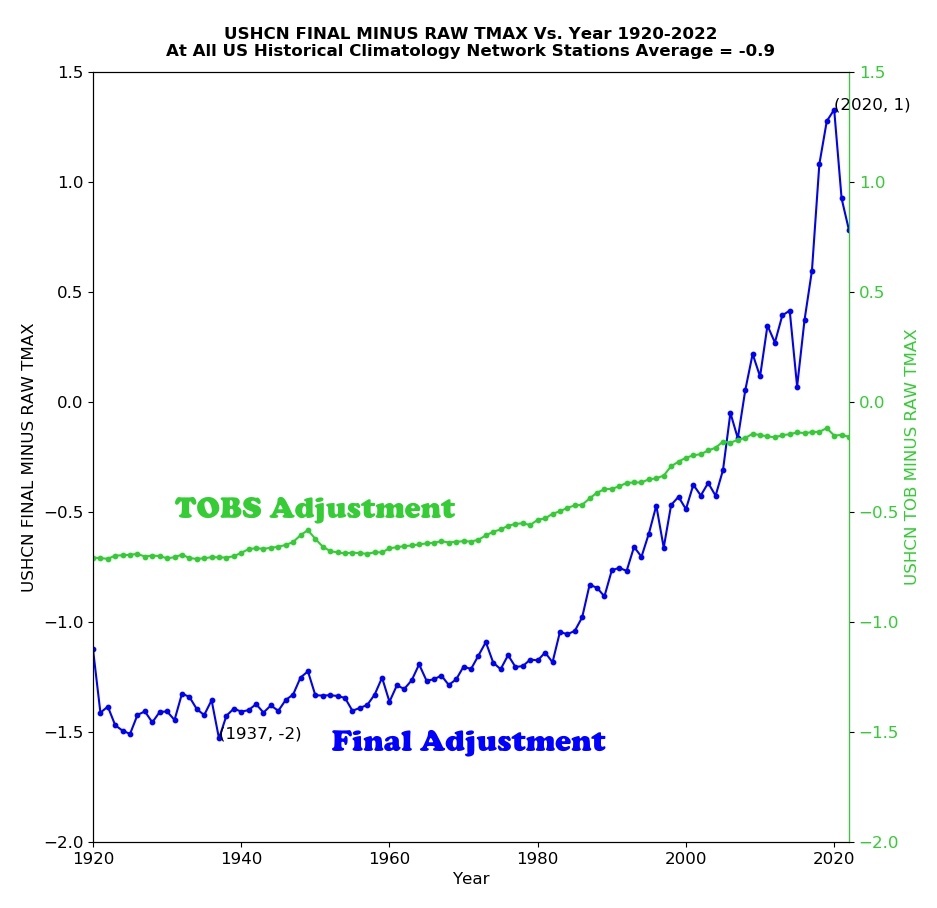
Older temperatures are cooled about 1,5F and recent temperatures are being warmed by similar amount.
A small part of the adjustment is Time Of Observation Bias.
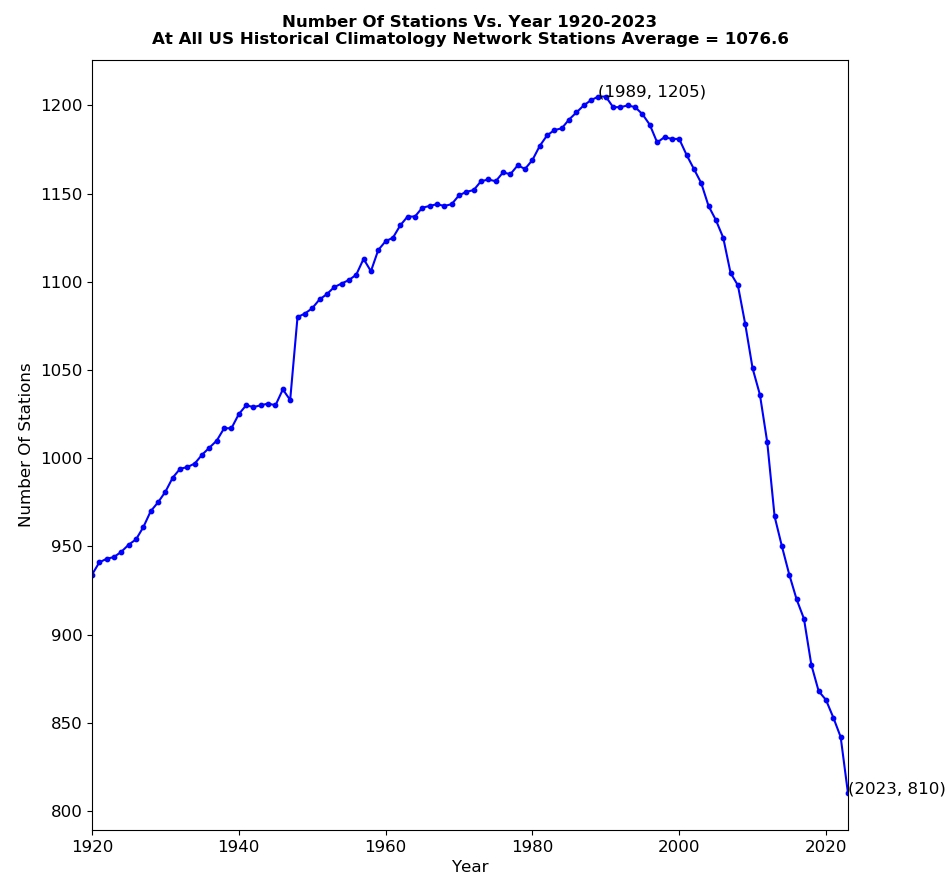
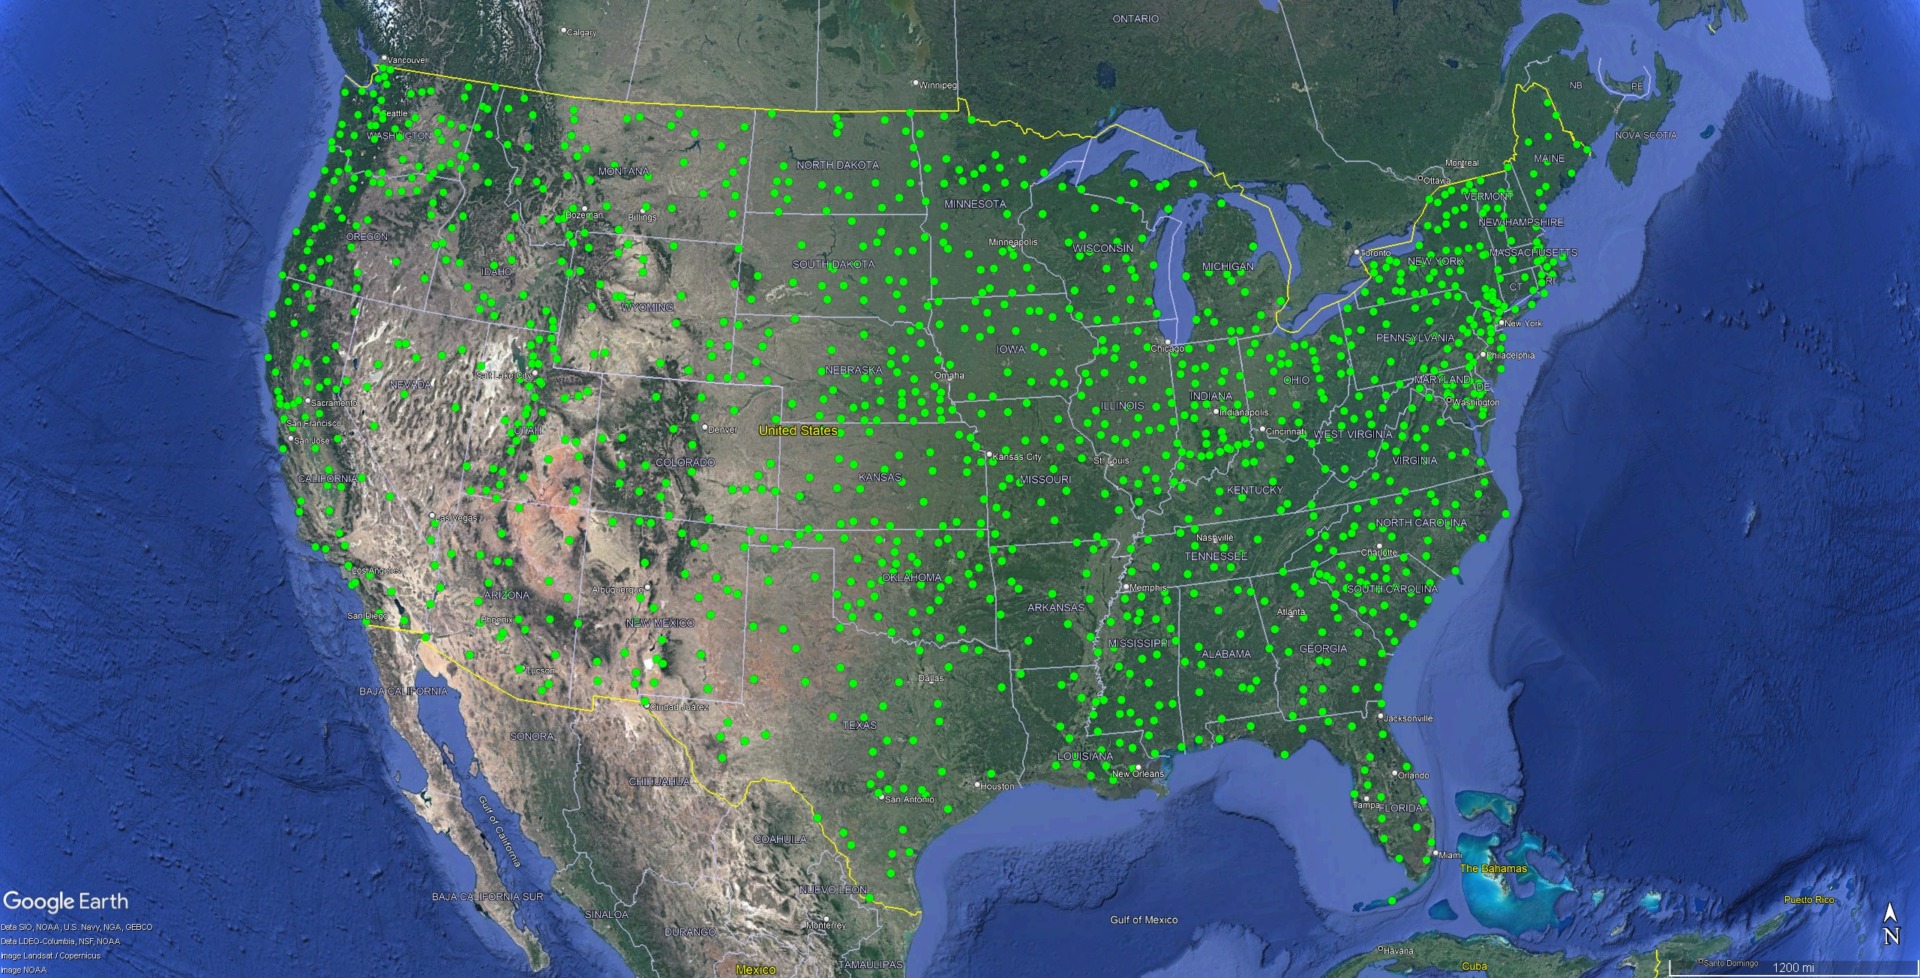
Most of the data tampering is being done by fabricating temperatures at stations where they have no thermometer readings. NOAA has been losing stations very rapidly since 1989
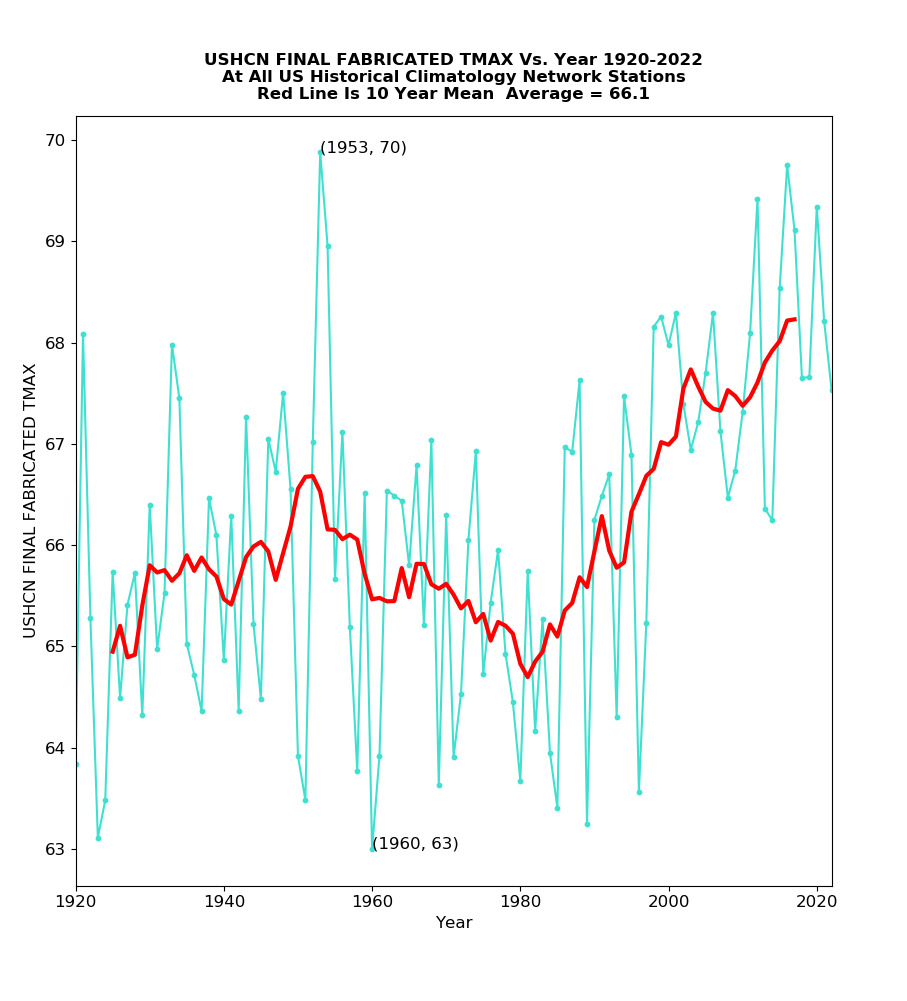
In their final adjusted data set they create fake temperatures for stations with no data, which is almost half of the stations.
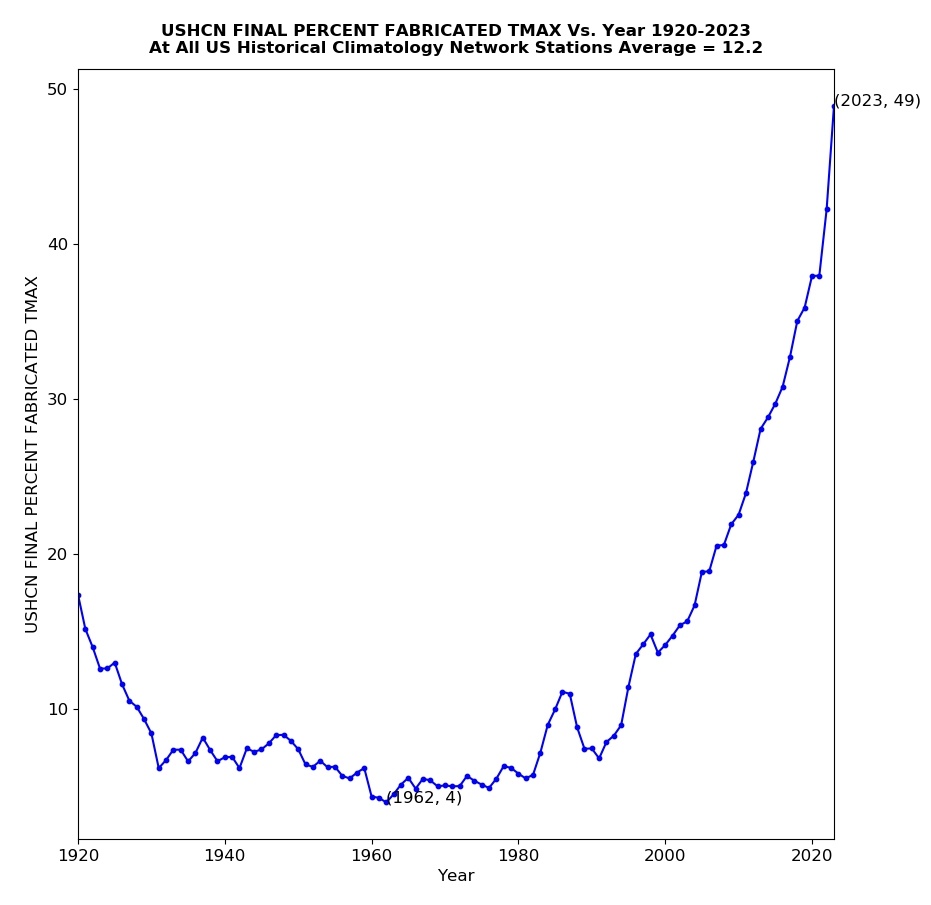
The fabricated temperatures have more than three degrees warming, which accounts for almost all of the adjusted temperature rise.
US temperatures are very important, because most of the world has little or no high quality long-term temperature data.
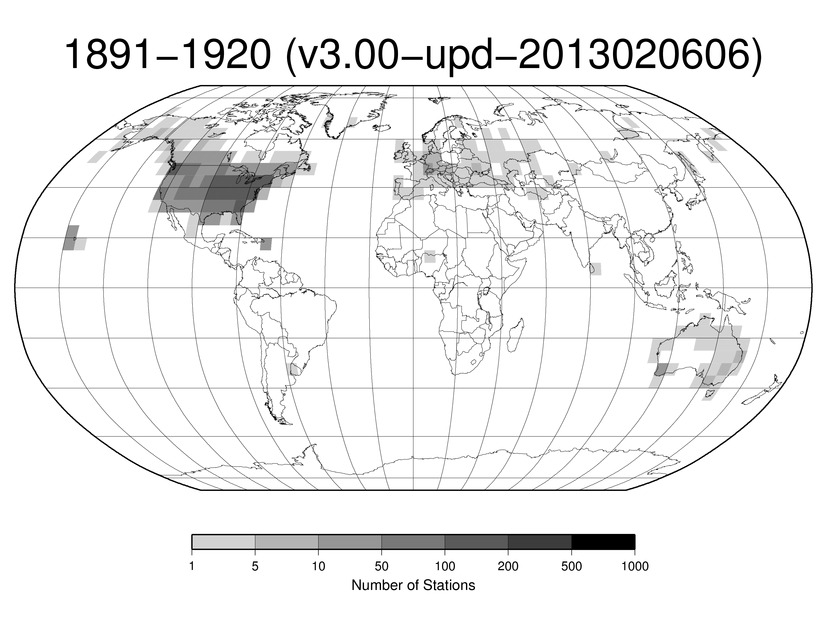
ftp://ftp.ncdc.noaa.gov/pub/data/ghcn/daily/figures/station-counts-1891-1920-temp.png
