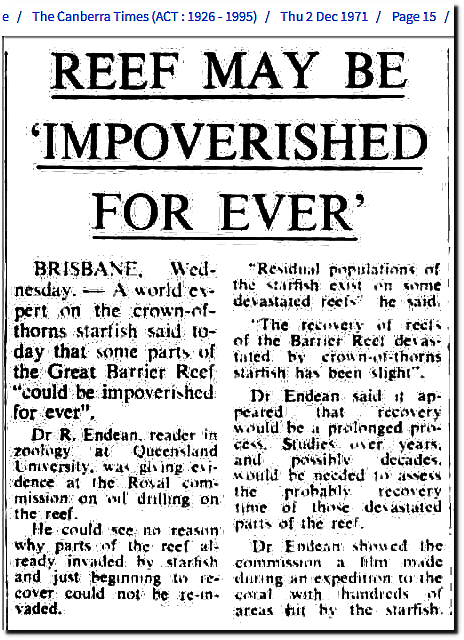
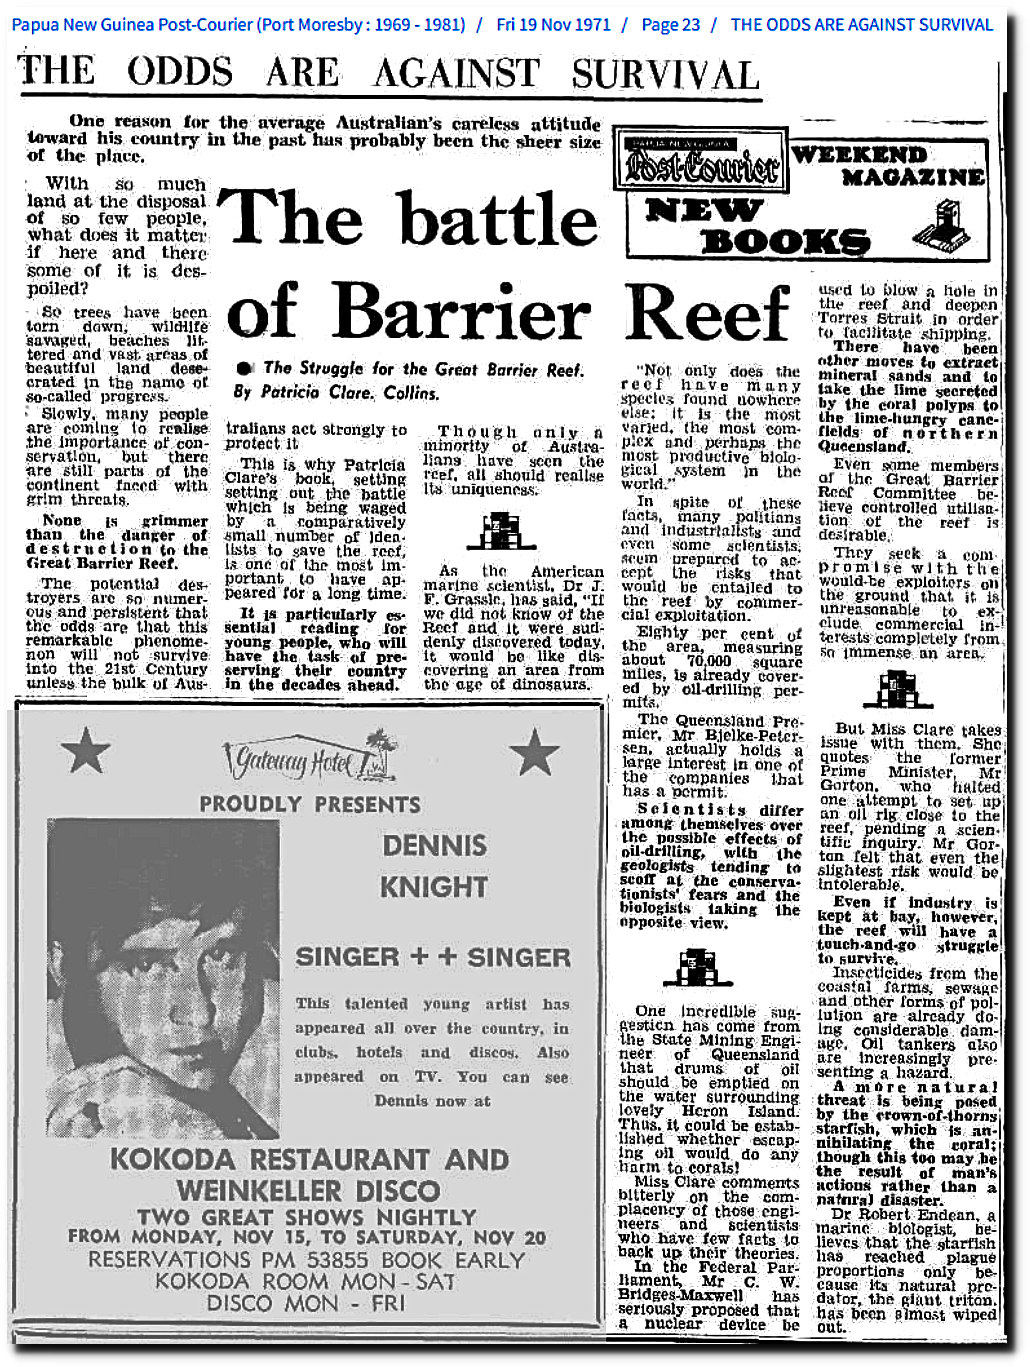
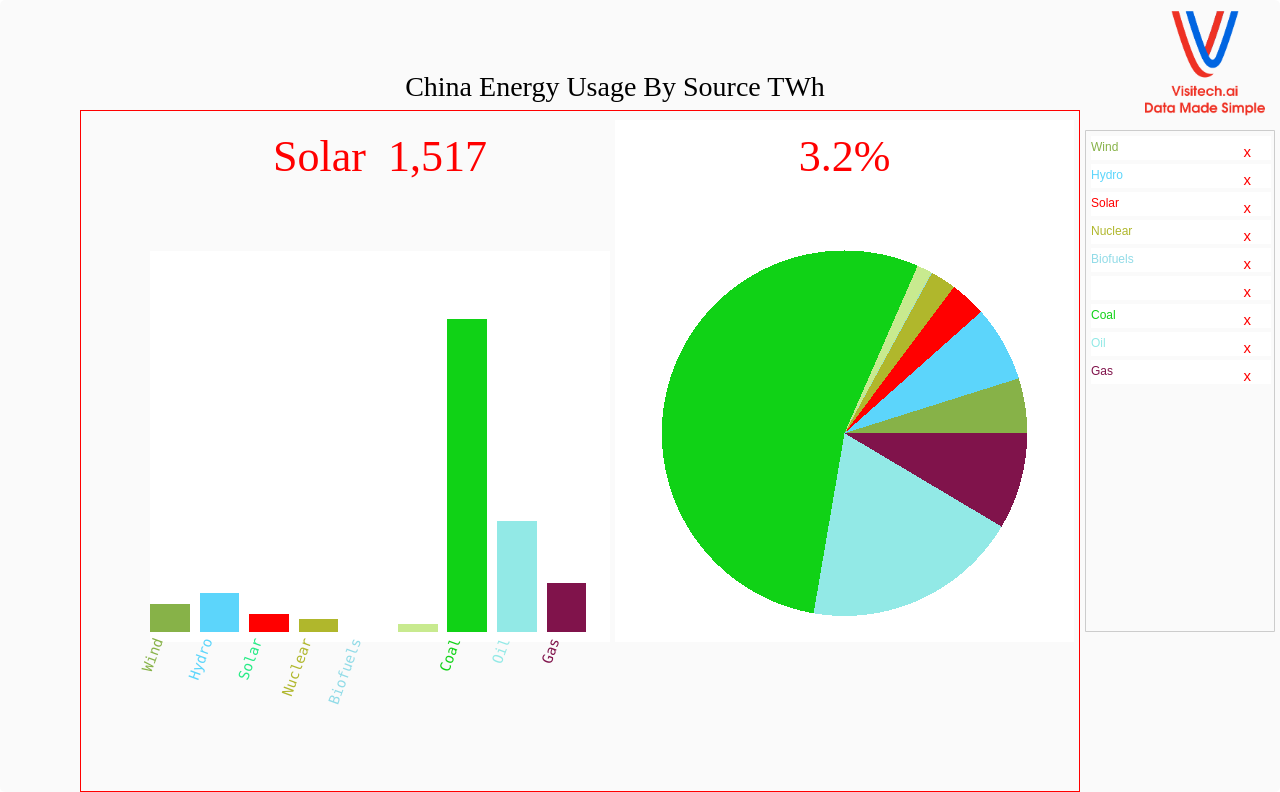
During the summer of 2012, Arctic experts announced the imminent collapse of Arctic sea ice. Extent has increased 24% since then.
Greenland’s Petermann Glacier has grown almost ten miles since experts announced its demise in 2012.
During the summer of 2012, Arctic experts announced the imminent collapse of Arctic sea ice. Extent has increased 24% since then.
Greenland’s Petermann Glacier has grown almost ten miles since experts announced its demise in 2012.
The Titanic sank on April 14, 1912, largely due to the weather in 1910 and 1911. The warmest March on record in the US occurred in March 1910
This occurred shortly before Earth passed through the tail of Halley’s Comet
Mar 13, 1910, page 13 – The Baltimore Sun at Newspapers.com
Mar 19, 1910, page 13 – The Ottawa Journal at Newspapers.com
The US went into severe drought for seventeen months.
This led to the largest wildfire in US history during August 1910
“On August 20 hurricane-force winds swept through the region and fanned embers and low flames back to life all across the Northern Rockies. There was no stopping or containing the fire; one could only hope to avoid it. Trains raced to evacuate towns just ahead of the flames. Forester Edward G. Stahl recalled that flames hundreds of feet high were “fanned by a tornadic wind so violent that the flames flattened out ahead, swooping to earth in great darting curves, truly a veritable red demon from hell.” In the same instant that towns and timber alike perished, heroes were made, legends were born, and history changed forever.”
The 1910 Fires – Forest History Society
There was a worldwide heatwave in 1911 which led to unprecedented Arctic melting, Temperatures in Greenland reached 94F, and an “enormous crop” of icebergs were set adrift.
Sep 17, 1911, page 6 – The Atlanta Constitution at Newspapers.com
Glaciers were disappearing in Switzerland.
18 May 1911 – GRAVE NEWS ABOUT GLACIERS. – Trove
40,000 people in France died from the heat
In 1911, Paris was already suffocating under the heatwave – Le Parisien
New England had their worst heatwave.
Jul 05, 1911, page 1 – The Boston Globe at Newspapers.com
July 4, 1911 was hottest on record in the US.
There were many record warm days and nights during 1911
In 1912, the sinking of the Titanic was blamed on excess icebergs caused by the warm weather of the previous two years.
May 08, 1912, page 9 – Courier-Post at Newspapers.com
At the Nobel Prize ceremony on December 10, 2007, Al Gore predicted an ice-free Arctic by 2014. There has been no trend in Arctic sea ice coverage since then.
ftp://sidads.colorado.edu/DATASETS/NOAA/G02135/north/daily/data/N_seaice_extent_daily_v3.0.csv
At the 1989 AGU meeting, NOAA’s Tom Karl said most global warming occurred before 1919 and earth cooled from 1921 to 1979
“Analysis of warming since 1881 shows most of the increase in global temperature happened before 1919 — before the more recent sharp rise in the amount of carbon dioxide in the atmosphere, said Thomas Karl, of the National Oceanic and Atmospheric Administration’s National Climate Data Center in Asheville, N. C.
While global climate warmed overall since 1881, it actually cooled from 1921 to 1979, Karl said.
“In spite of all the well-publicized concern about global warming, you must understand that there is still considerable uncertainty among scientific experts about a number of critical factors which determine global warming,” NOAA administrator John Knauss said in a statement issued for the geophysics meeting.”
07 Dec 1989, 44 – The Tyler Courier-Times at Newspapers.com
But the climate at government has changed, and NOAA has since rewritten earth’s history.
Climate at a Glance | Global Time Series | National Centers for Environmental Information (NCEI)
Gen Z writer calculates five degrees of June warming in Philadelphia based on two data points, and says it is up to the city council to lower temperatures.
Mystery Shopper: Does City Council Answer Residents?
June afternoon temperatures in Pennsylvania have declined over the past century. The blue line shows the Gen Z calculated trend since 2004.
The most active US hurricane season was 1886, when Texas was hit by four hurricanes and Florida was hit by three, yet according to NASA’s very detailed (and fake) global temperature map, Atlantic temperatures were quite cool.
How do they create these very detailed maps with almost no temperature data?
Data.GISS: GISS Surface Temperature Analysis (v4): Station Data
Fabricated US temperature data from NOAA appears to have a change in their algorithm after the 1998 El Nino. The fake temperatures were shifted upwards by about three degrees.
The 1998 shift is how NOAA creates the fake warming in their graphs
NOAA shows about 2.5 degrees of warming in US maximum temperatures over the past 50 years
Climate at a Glance | National Time Series | National Centers for Environmental Information (NCEI)
This increase doesn’t exist in the measured daily or equivalent raw monthly NOAA data sets.
The TOB adjustment adds about half a degree warming over the past 50 years
The final adjustment adds another 1.5 degrees warming since the 1970s
About half of the data used in the final adjustment is now fabricated, i.e from a computer model rather than a thermometer.
The real (i.e. from thermometers) component of the final adjusted data set shows about one degree warming since the 1970s
But the fabricated component of the final adjusted data set shows about four degrees warming
Most of the warming over the past 50 years is due to fabricated data, not adjustments
Since 1970, the measured thermometer data shows almost no warming.
The measured adjusted data is warming at about two degrees per century
But the fabricated data is warming at eight degrees per century. Note the big jump after 1995.
The majority of warming over the past 50 years being reported by NOAA is due to fake data.
The NCDC data shows the same big jump after 1995, which exists only in the fabricated data.
Academia and the press have been fear mongering about the collapse of the West Antarctic Ice Sheet for over 50 years, but that scam seems to be collapsing.
The ‘Doomsday’ glacier may soon trigger a dramatic sea-level rise
Scientists are baffled about rapid cooling of the Atlantic Ocean. I’m not baffled, because this was the core of Bill Gray’s thermohaline circulation theory.
Warm heavily saline water collects at the surface of the Atlantic Ocean. When it starts to cool, it becomes too dense to float. Then it sinks and gets replaced by cold, less saline water from depth. This cycle repeats over and over again.
Instead of listening to intellectual giants like Bill Gray, the press listens to mental midgets like Michael Mann.
Atlantic Niña: The Atlantic is cooling at record speed and nobody knows why | New Scientist