





Disrupting the Borg is expensive and time consuming!

Google Search
-
Recent Posts
- Bullseye!
- It’s Getting Closer
- Greenland Meltdown Scam
- Greenland Ice Update
- Wyoming Gold
- Three Years Since The Apocalypse
- Arctic Report card Summer 2026
- Elon Pushing Pushing Geoengineering
- Earth, Wind And Fire
- On The Road Again
- Vandalism At The Reflecting Pool
- Fifty Years Ago Today
- Truth Or Consequences
- US Climate Trend Maps
- Declining Spring Snow Cover In Northern New Mexico
- You Can’t Fool Mother Nature
- Cattle And The Climate
- One Atomic Bomb Per Hour
- New Video : Analyzing Oil And Gas
- Is Antarctica Melting?
- High Speed Analysis And Visualization
- El Nino To The Rescue?
- Fake News Update
- Growth Of Antarctic Sea Ice
- 65 Years Of Progress!
Recent Comments
- D. Boss on Bullseye!
- Bob G on Bullseye!
- Bob G on Bullseye!
- Bob G on Bullseye!
- Bob G on It’s Getting Closer
- Bob G on It’s Getting Closer
- Bob G on Greenland Meltdown Scam
- conrad ziefle on Greenland Meltdown Scam
- Terry Shipman on Wyoming Gold
- Crispin Pemberton-Pigott on Wyoming Gold
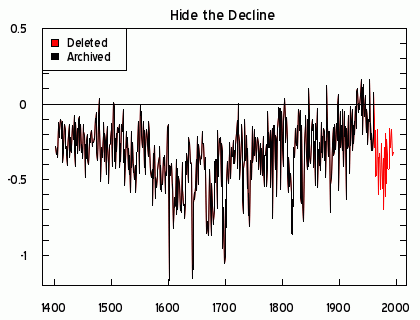
Erasing The “little tropical age”
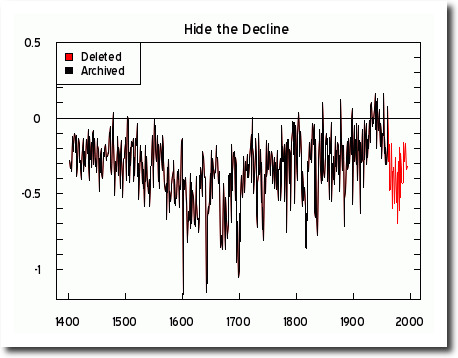
In 1998 there were two competing temperature reconstructions being considered by the UN IPCC. Briffa’s reconstruction was fairly accurate but was rejected because it didn’t show what the politicians in charge of the process wanted to see. Instead they used Michael Mann’s wildly fraudulent hockey stick.
Posted in Uncategorized
Leave a comment
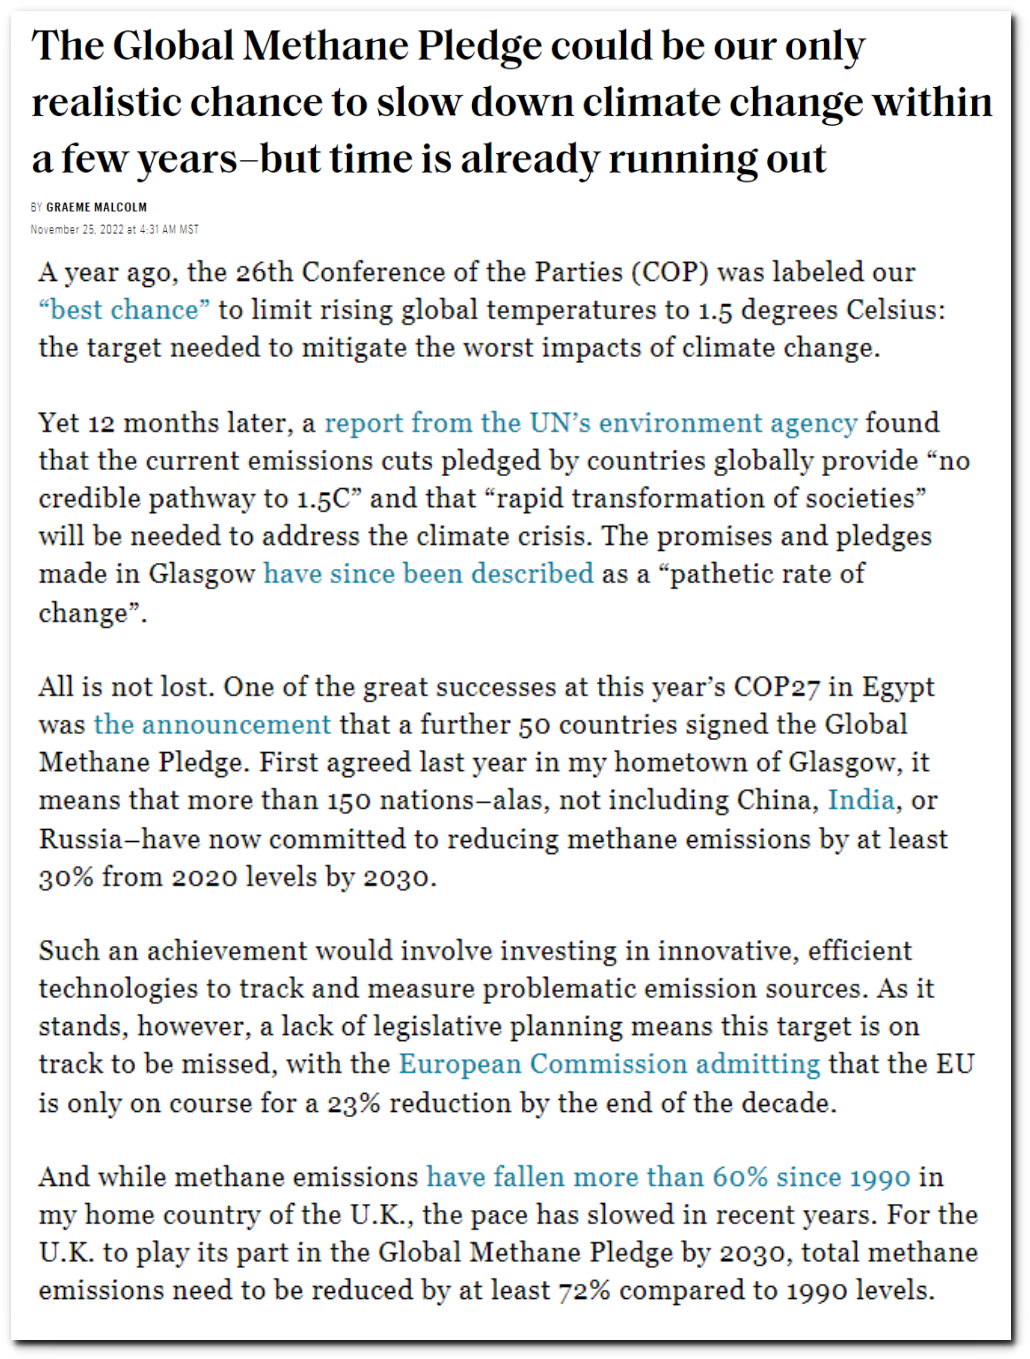
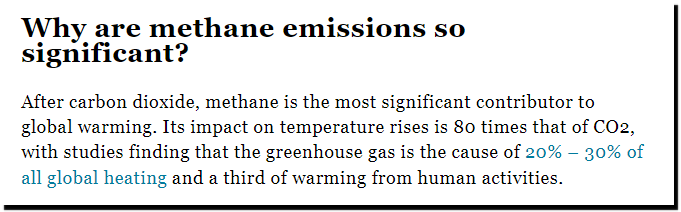
“80 times that of CO2”
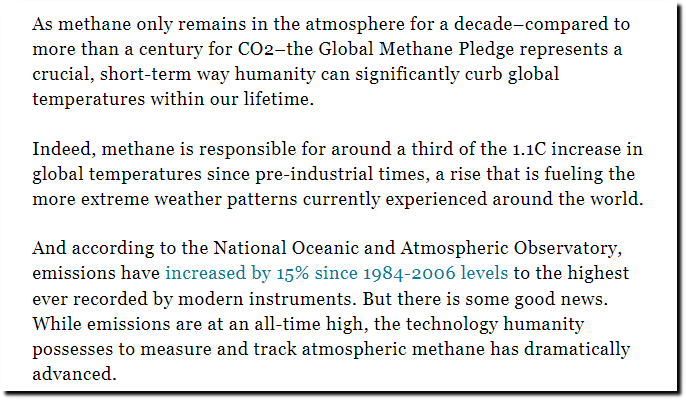
Methane is for all intents and purposes irrelevant as a greenhouse gas in earth’s atmosphere, because of very low concentrations and overlap of its spectral bands with H2O. So journalists make up completely fake statistics about methane.
“Indeed, methane is responsible for around a third of the 1.1C increase in global temperatures since pre-industrial times, a rise that is fueling the more extreme weather patterns currently experienced around the world … Its impact on temperature rises is 80 times that of CO2”
Posted in Uncategorized
Leave a comment
Erasing The 1940s Blip
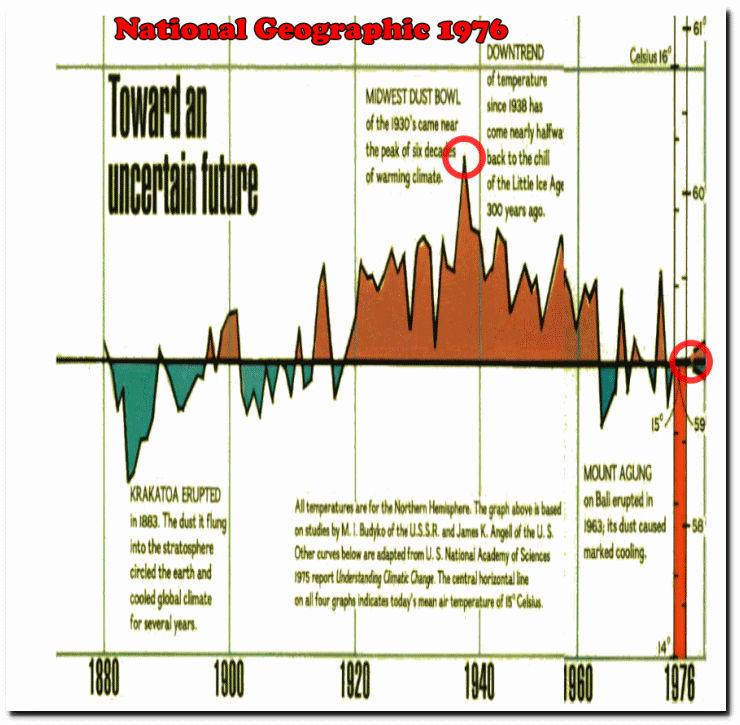
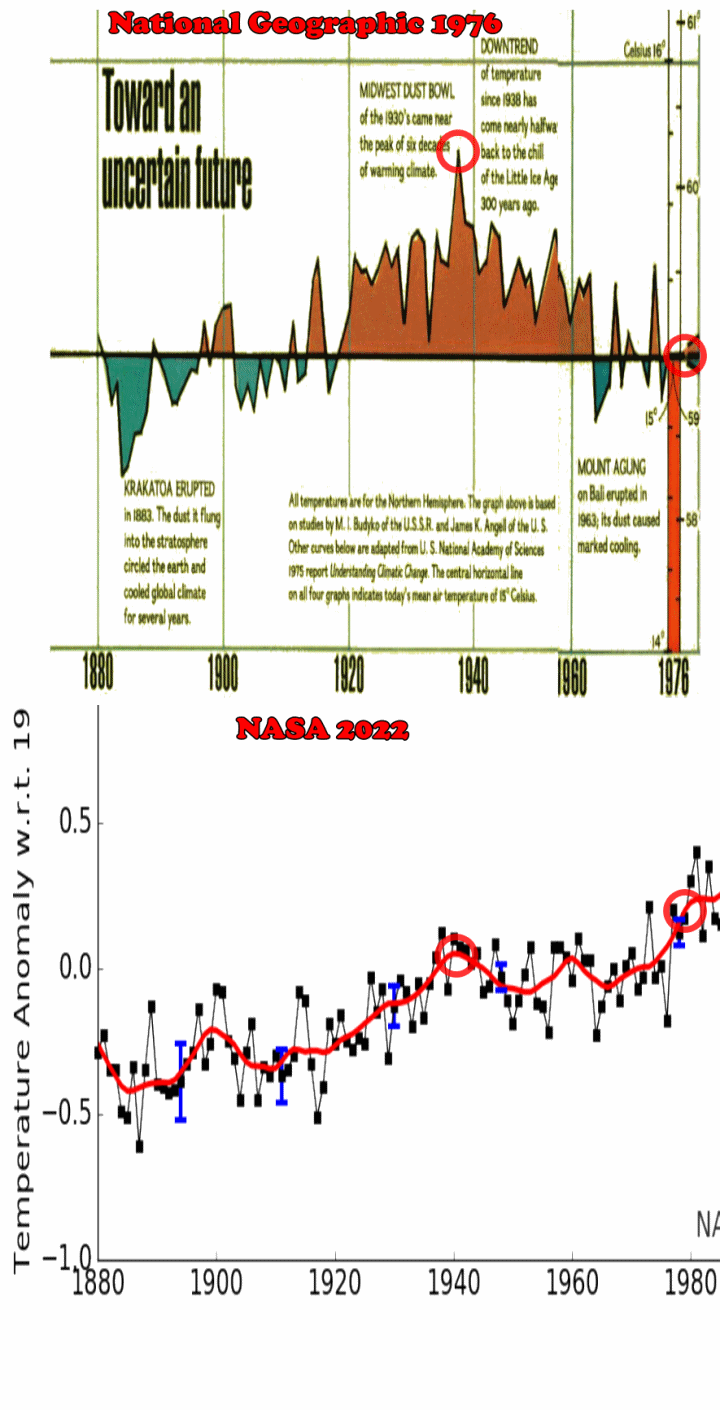
In 1976, National Geographic showed a strong cooling trend from 1938-1976, and showed that 1976 was no warmer than 1880
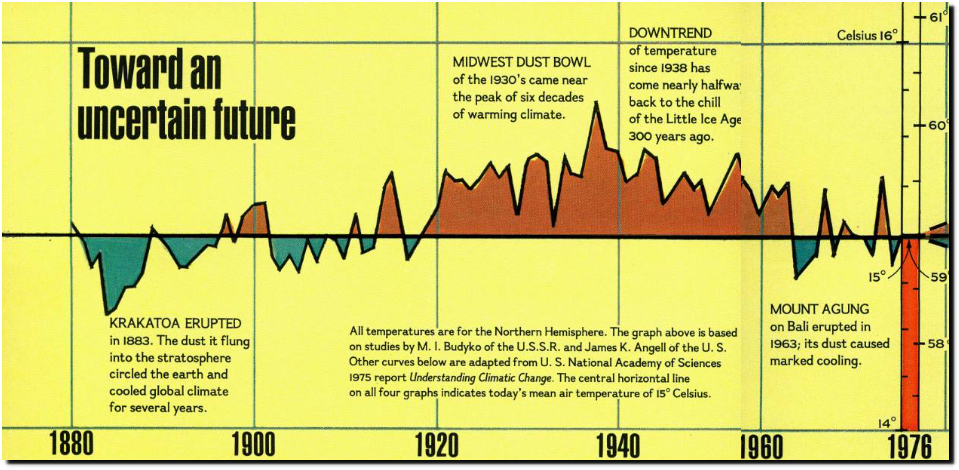
National Geographic Magazine Archive
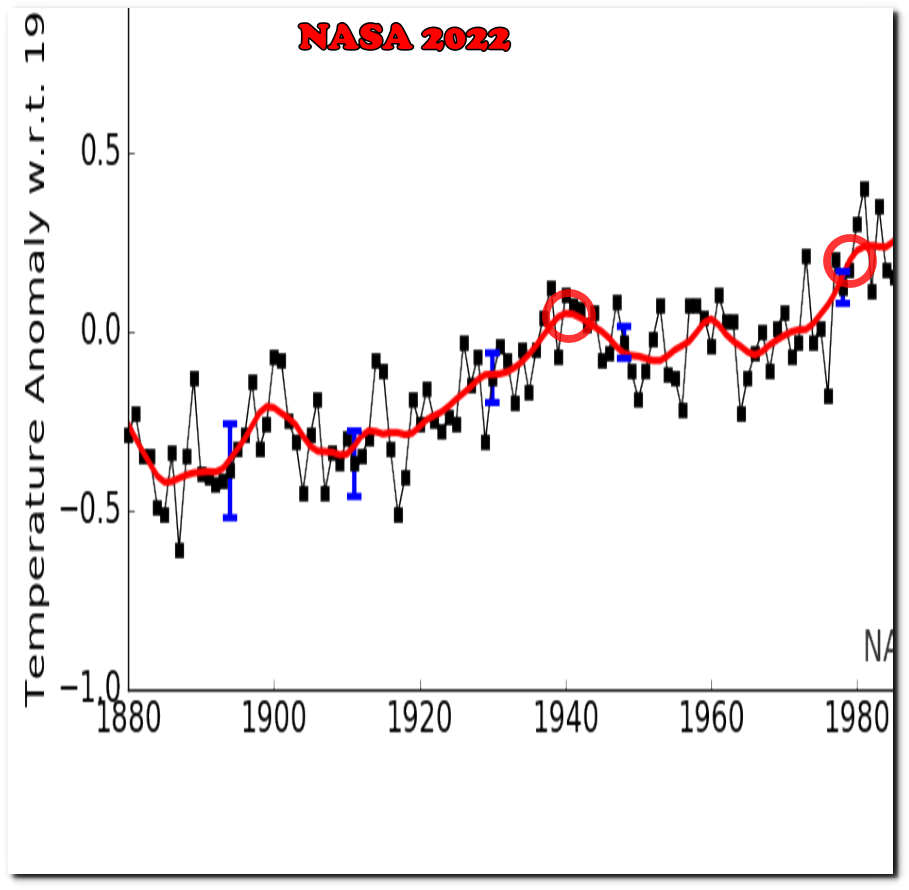
NASA has since altered the data to remove the 1940s blip.
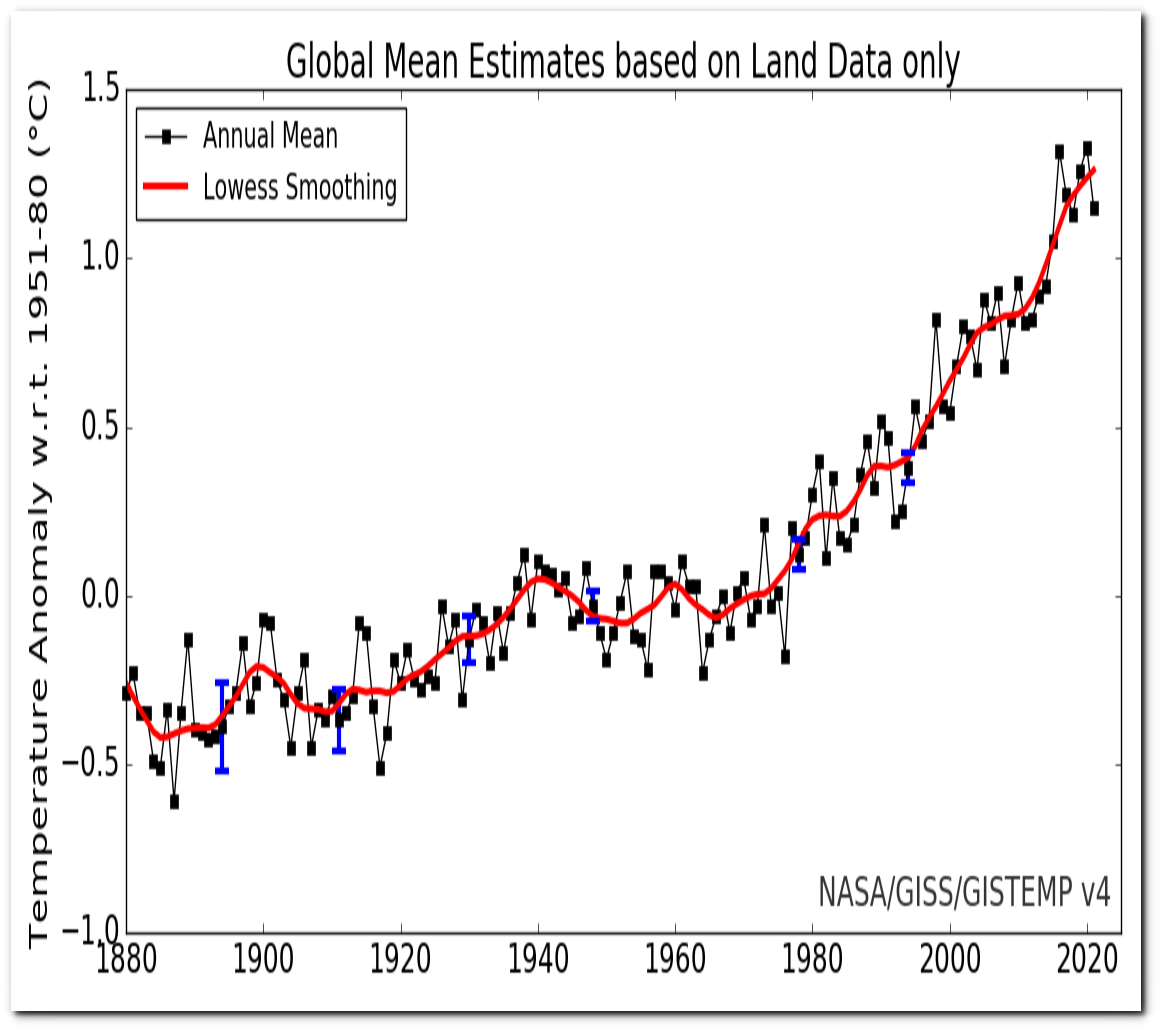
Analysis of warming since 1881 shows most of the increase in global temperature happened before 1919 — before the more re-cent sharp rise in the amount of carbon dioxide in the atmosphere. said Thomas Karl, of the National Oceanic and Atmospheric Administration’s National Climatic Data Center in Asheville, N.C. While global climate warmed overall since 1881, it actually cooled from 1921 to 1979, Karl said
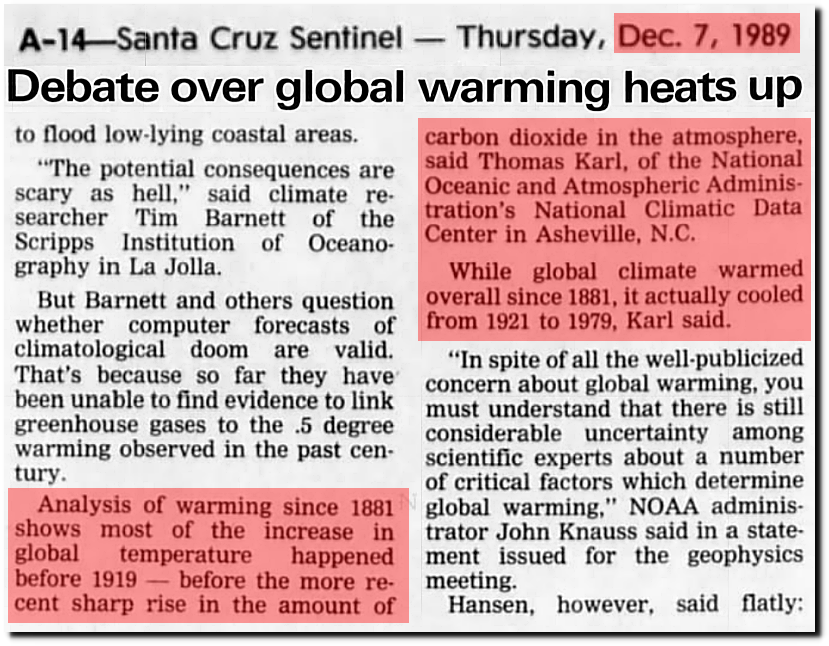
07 Dec 1989, Page 14 – Santa Cruz Sentinel at Newspapers.com
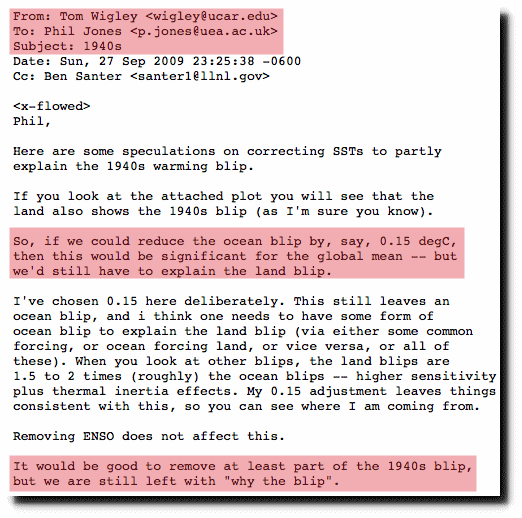
This was a critical part of hiding the decline.
Posted in Uncategorized
Leave a comment
“multiple lines of evidence”
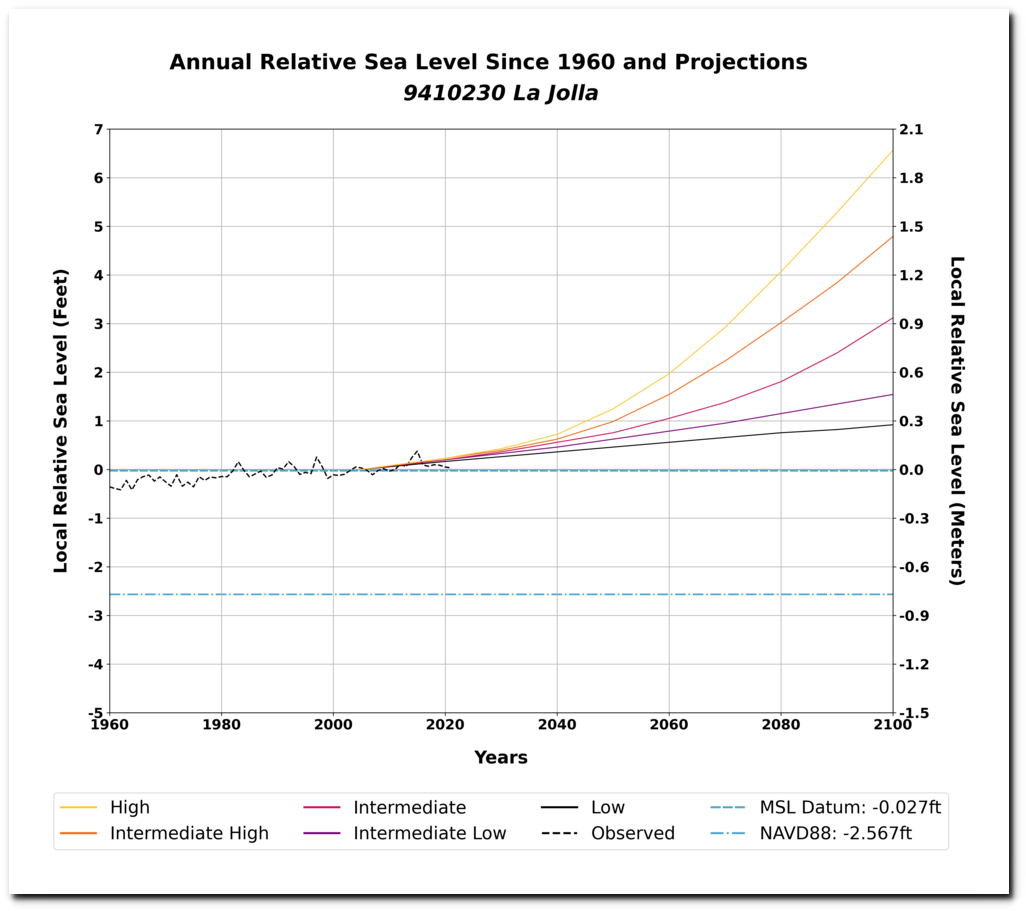
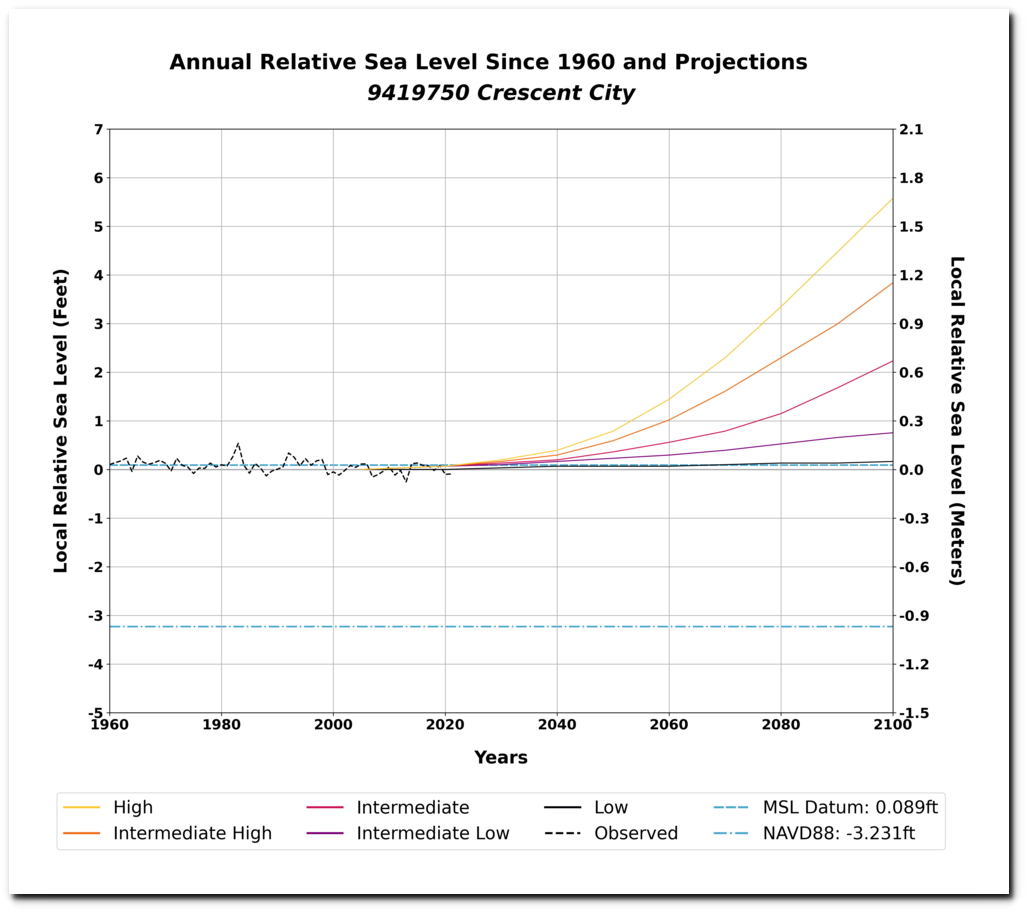
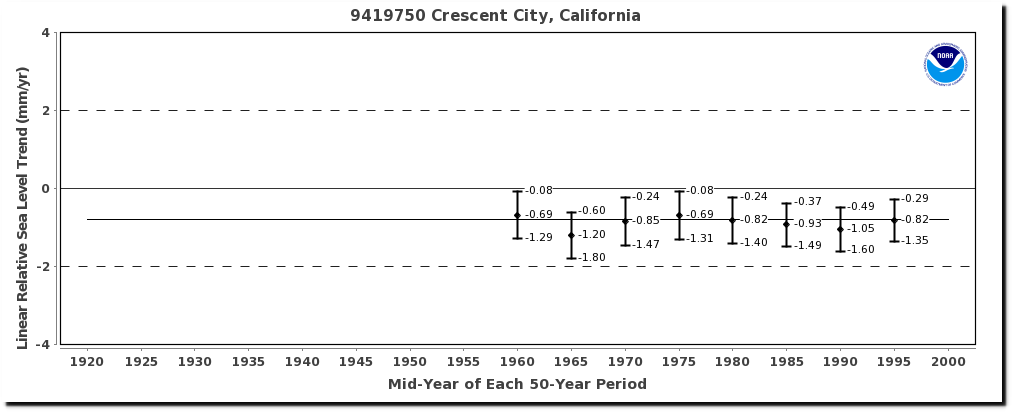
A new government study making the unsupportable claim that sea level rise is accelerating.
Posted in Uncategorized
Leave a comment
Biden Administration Discusses Pipelines
The White House shut down the Keystone-XL pipeline on the first day Biden occupied the White House – in order to save the planet from global warming. One year later the White House claimed that shutting down the pipeline didn’t make any difference.
Posted in Uncategorized
Leave a comment
“multiple lines of evidence”
When government scientists and the press claim “multiple lines of evidence” – it normally means they made the whole thing up.
“Global sea level has been rising for decades in response to a warming climate, and multiple lines of evidence indicate the rise is accelerating,” said NASA in a news release. “The new findings support the higher-range scenarios outlined in an interagency report released in February 2022.” That report was developed by multiple agencies including NASA, the National Oceanic and Atmospheric Administration (NOAA), and the U.S. Geological Survey. It projected significant sea level rise by region, including: 10 to 14 inches of rise on average for the East Coast 14 to 18 inches for the Gulf Coast 4 to 8 inches for the West Coast”
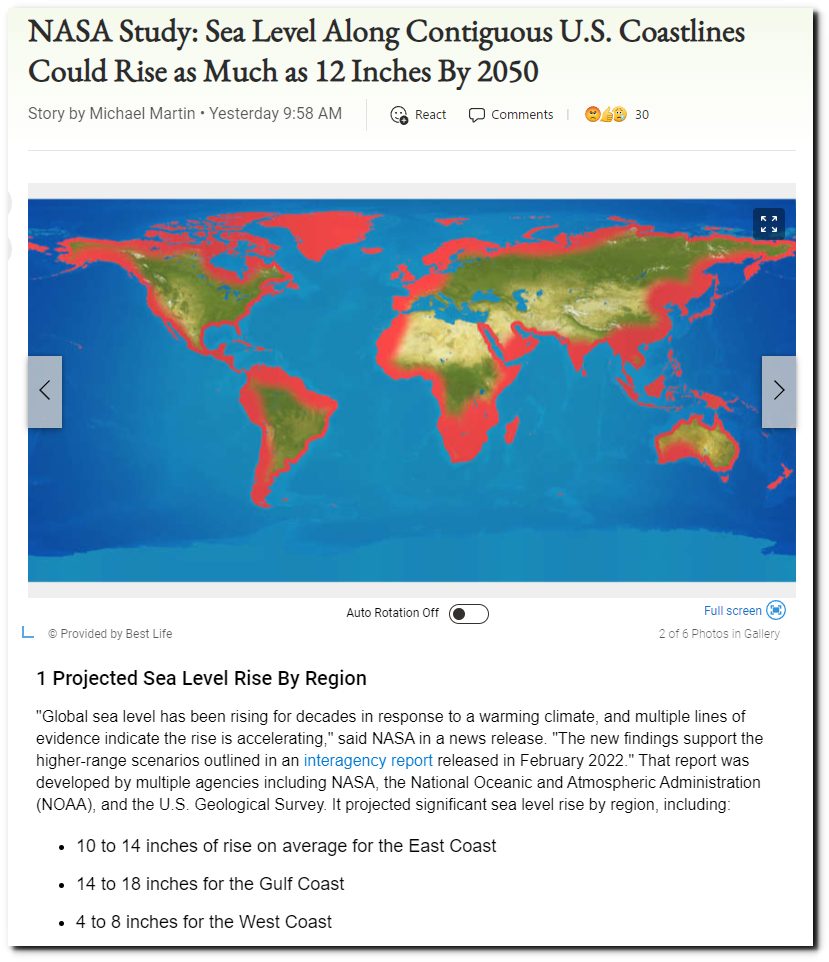
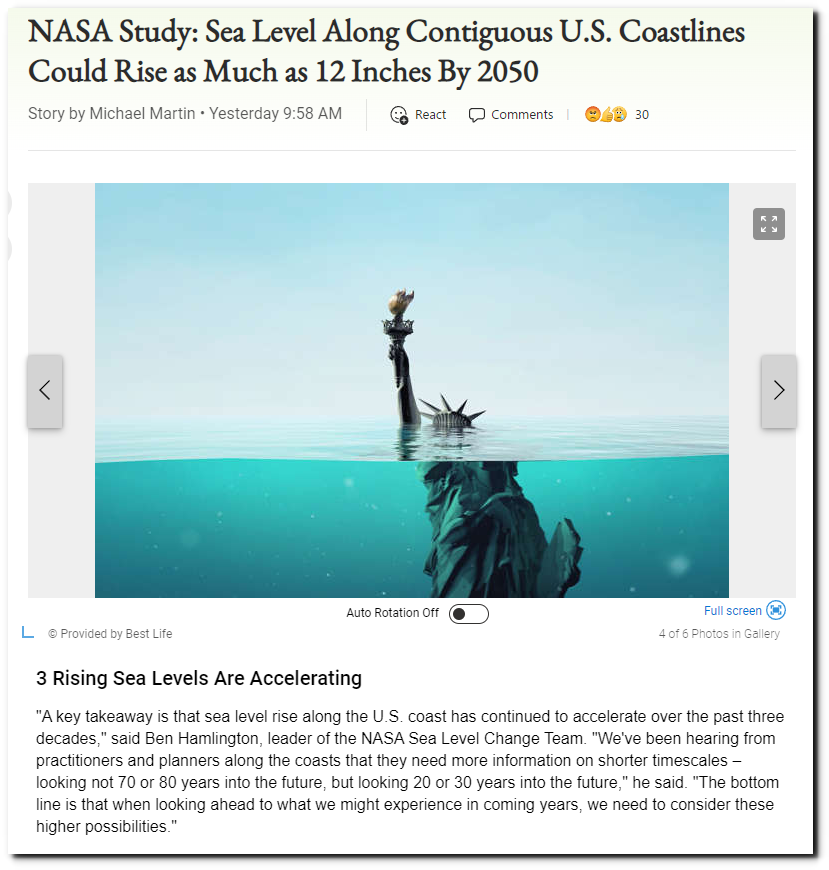
NASA Study: Sea Level Along Contiguous U.S. Coastlines Could Rise as Much as 12 Inches By 2050
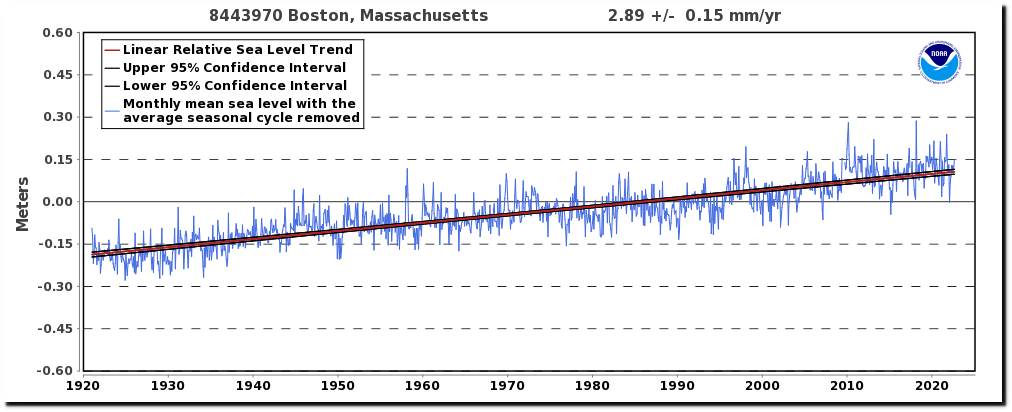
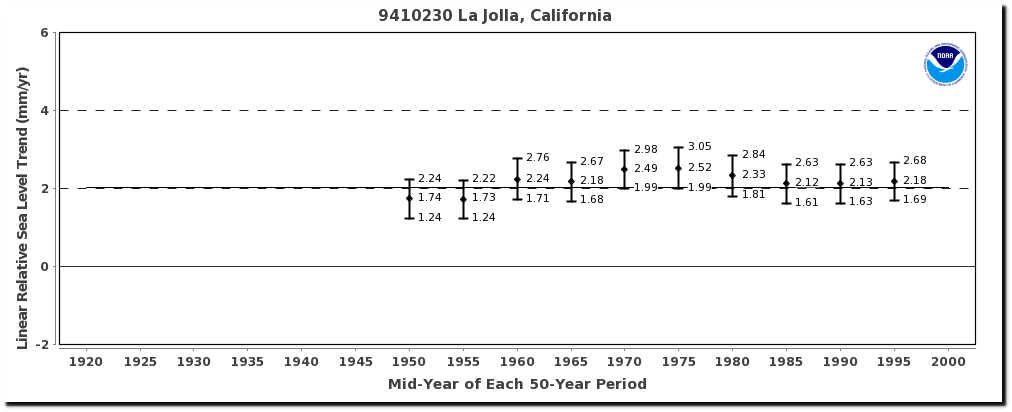
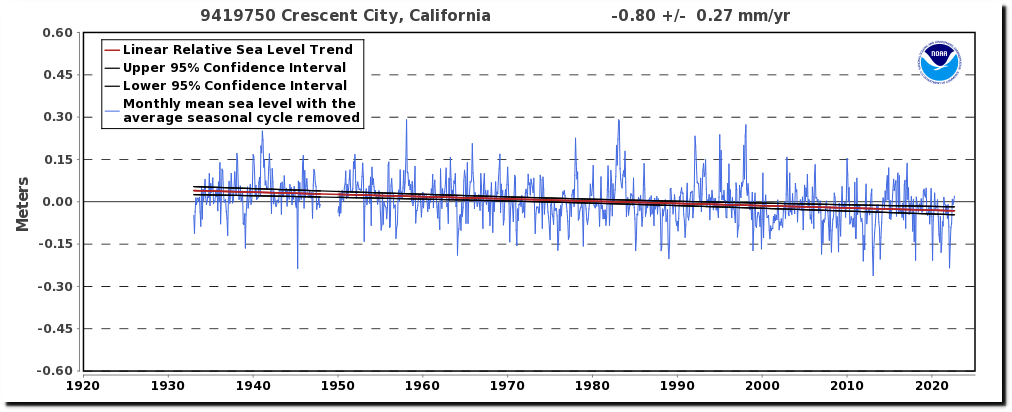
There is no indication sea level rise rates are accelerating.
“The absolute global sea level rise is believed to be 1.7-1.8 millimeters/year.”

Sea Level Trends – NOAA Tides & Currents
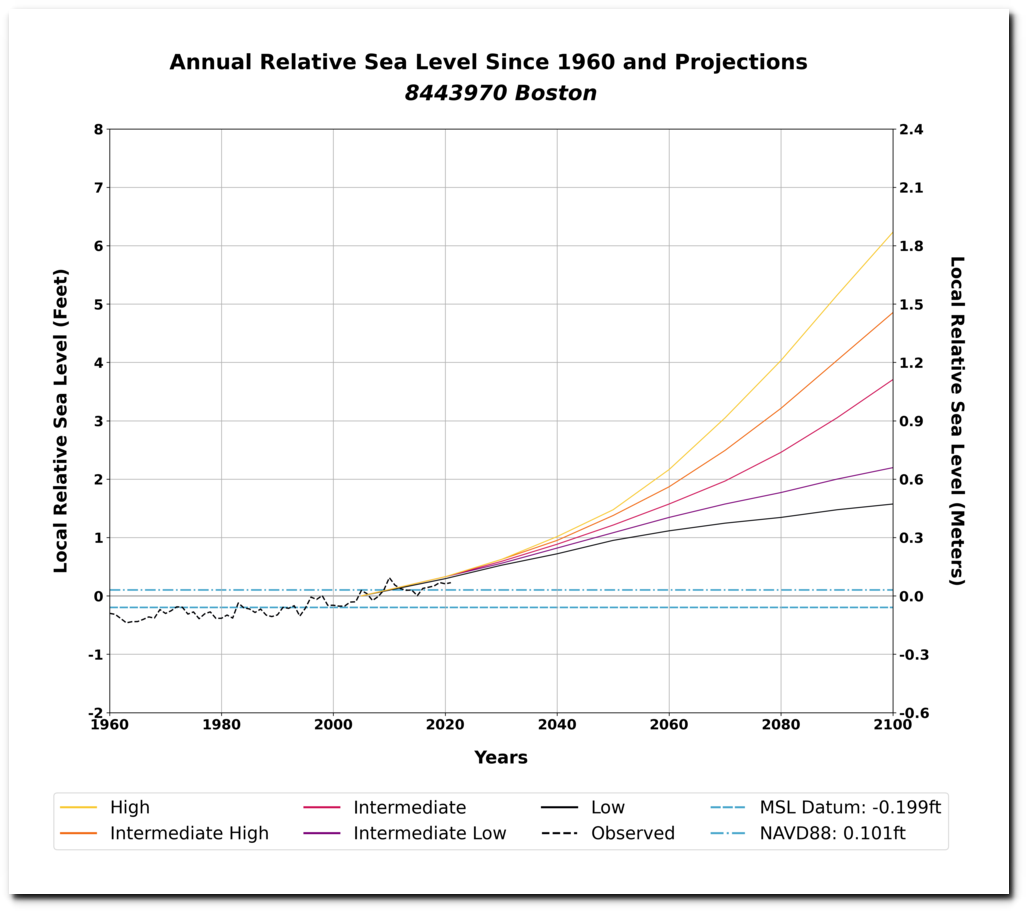
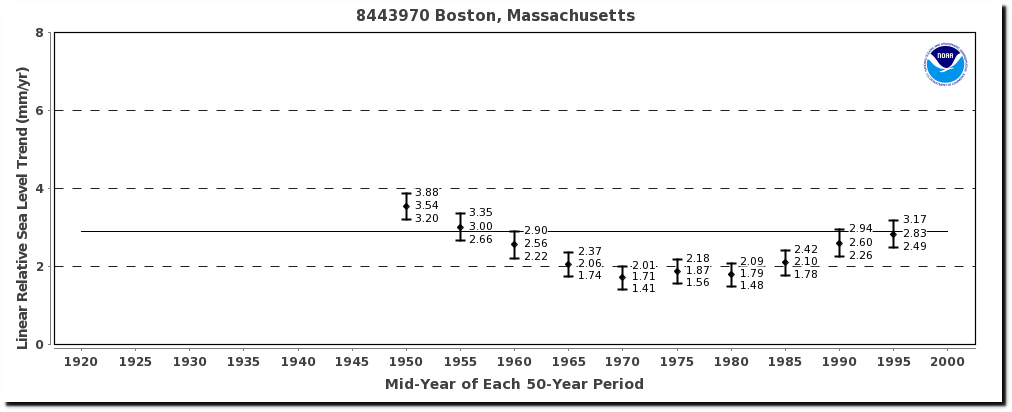
Sea Level Trends – NOAA Tides & Currents
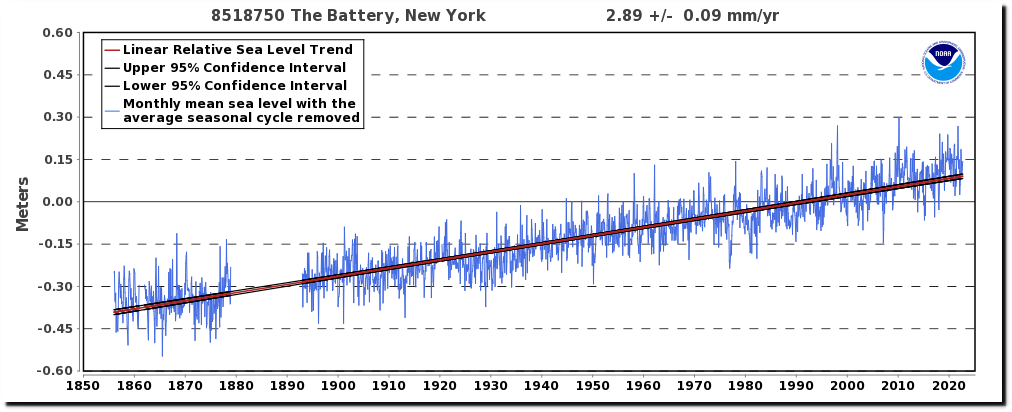
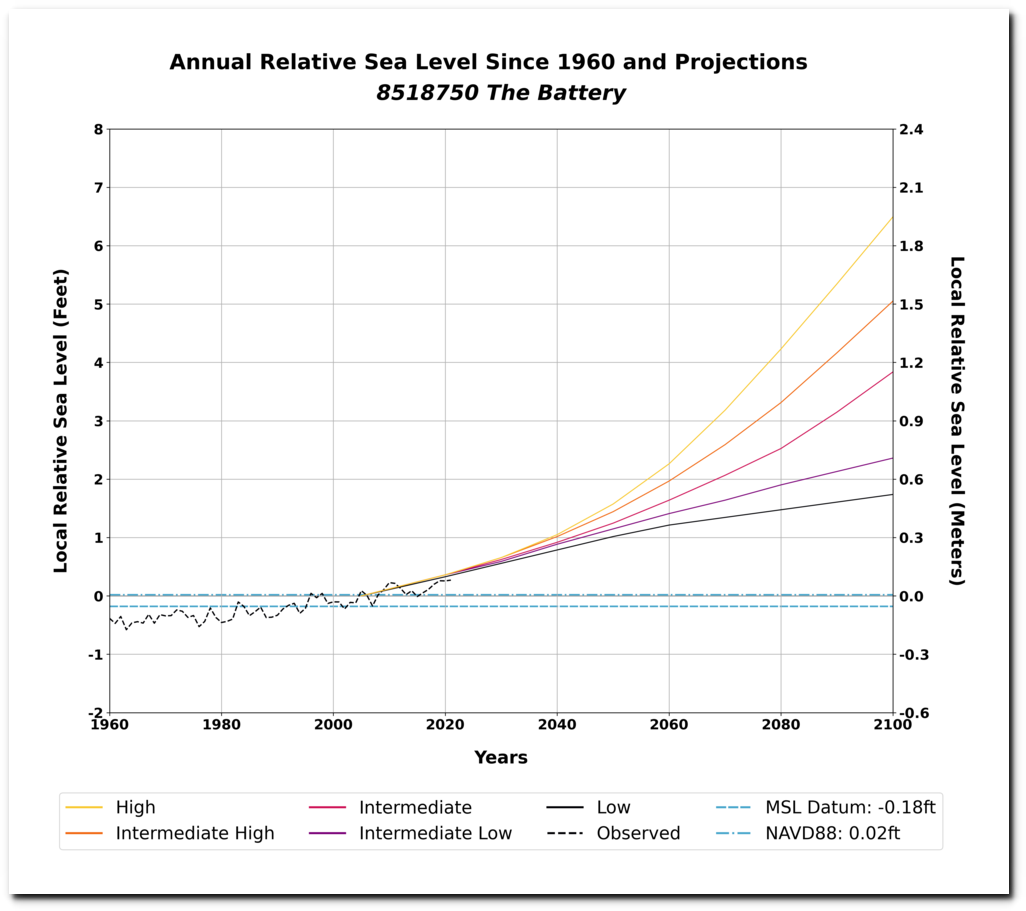
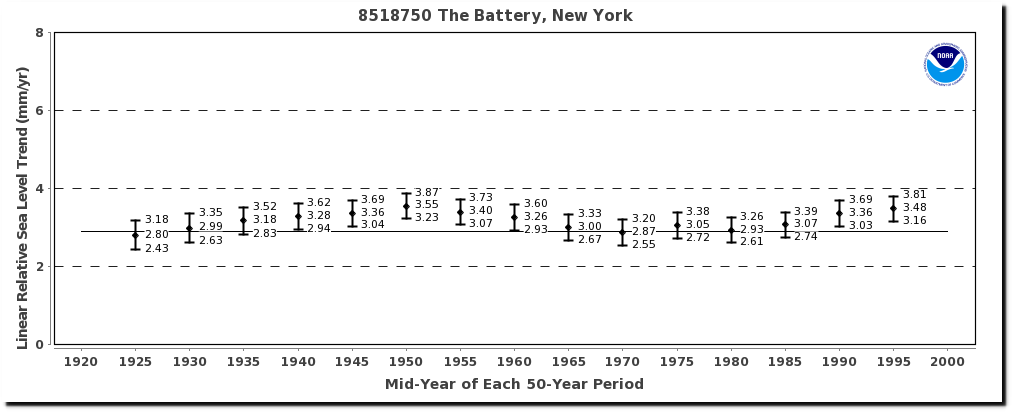
Sea Level Trends – NOAA Tides & Currents
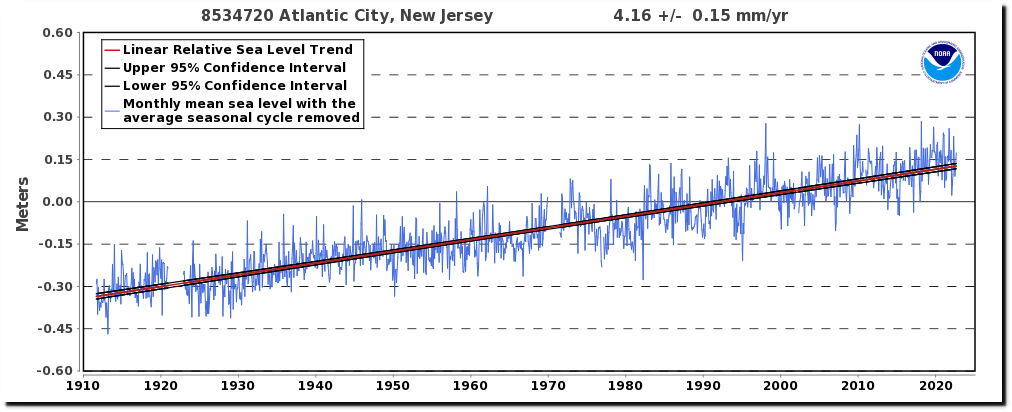
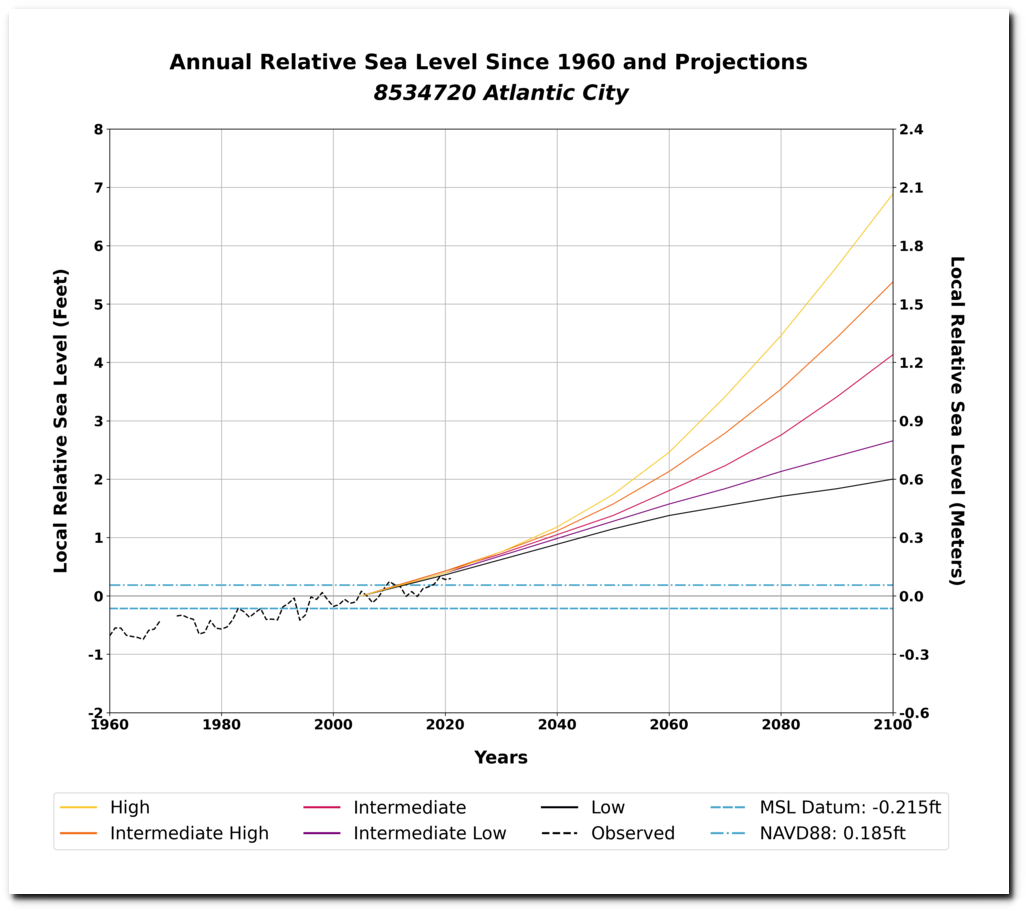
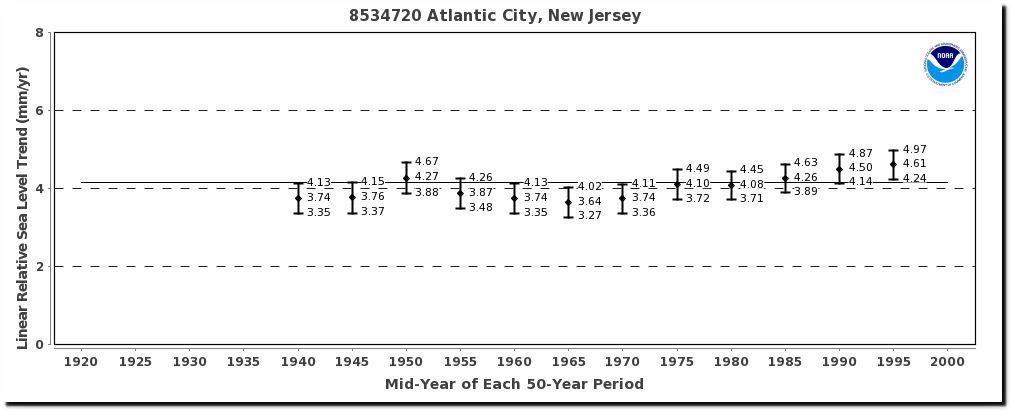
Sea Level Trends – NOAA Tides & Currents
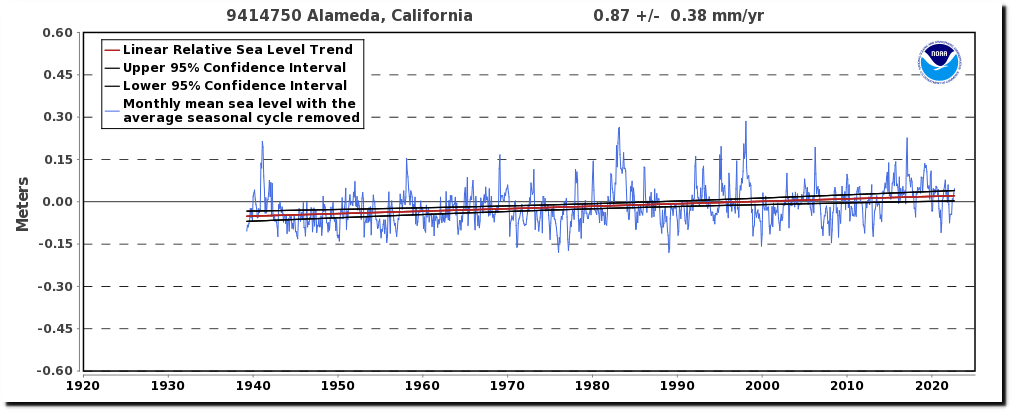
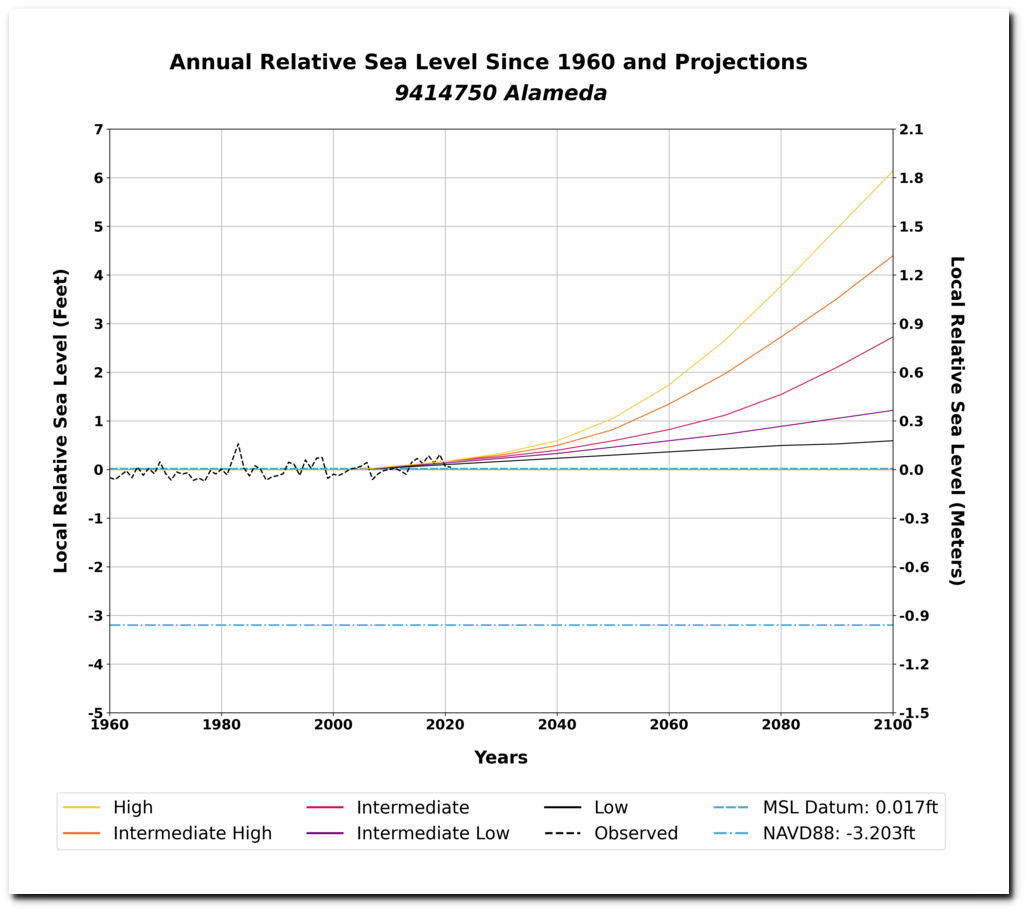
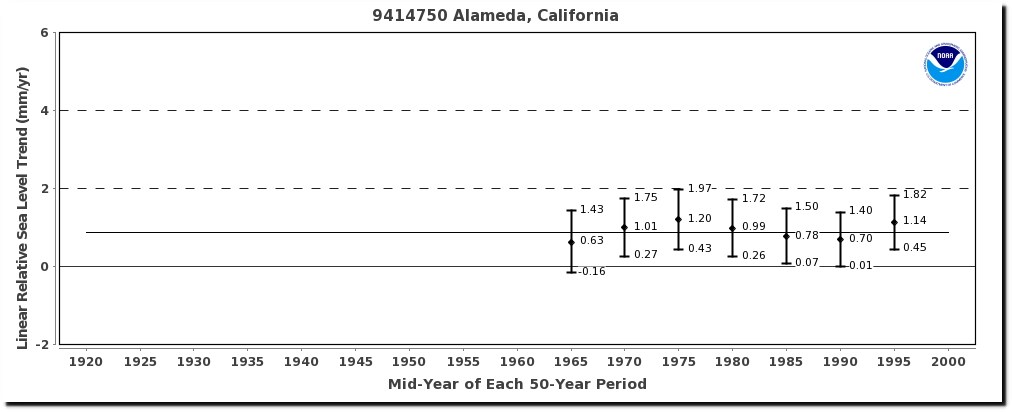
Sea Level Trends – NOAA Tides & Currents
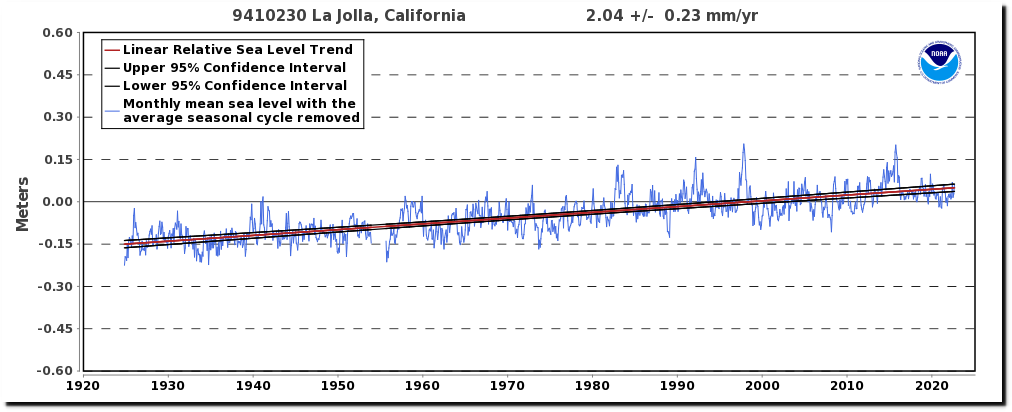
Sea Level Trends – NOAA Tides & Currents
Posted in Uncategorized
Leave a comment