In 1970, Arctic sea ice was becoming “ominously thicker.”
“The United States and the Soviet Union are mounting large scale investigations to determine why the Arctic climate is becoming more frigid, why parts of the Arctic sea ice have recently become ominously thicker and whether the extent of that ice cover contributes to the onset of ice ages.”
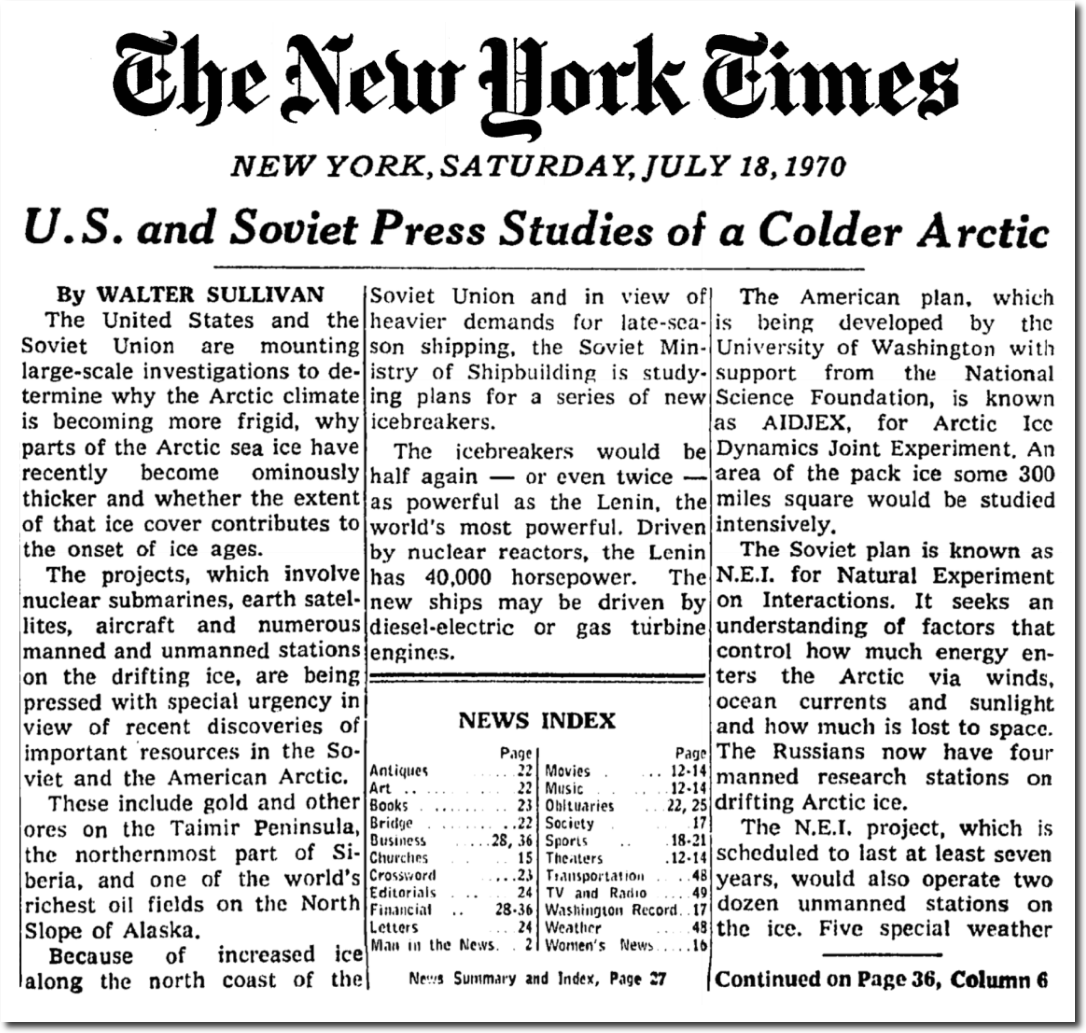

U.S. and Soviet Press Studies of a Colder Arctic – The New York Times
“The Earth Is Cooling, Return of Ice Age Is Feared
Snow banks cover areas of Baffin Island today which were seasonally snow-free 30 or 40 years before the present cooling, J. T. Andrews and his colleagues at the University of Colorado at Boulder report. Similarly, pack ice around Iceland is once again becoming the serious hindrance to navigation it was during the “‘little ice age”
14 Apr 1973, Page 8 – Iowa City Press-Citizen
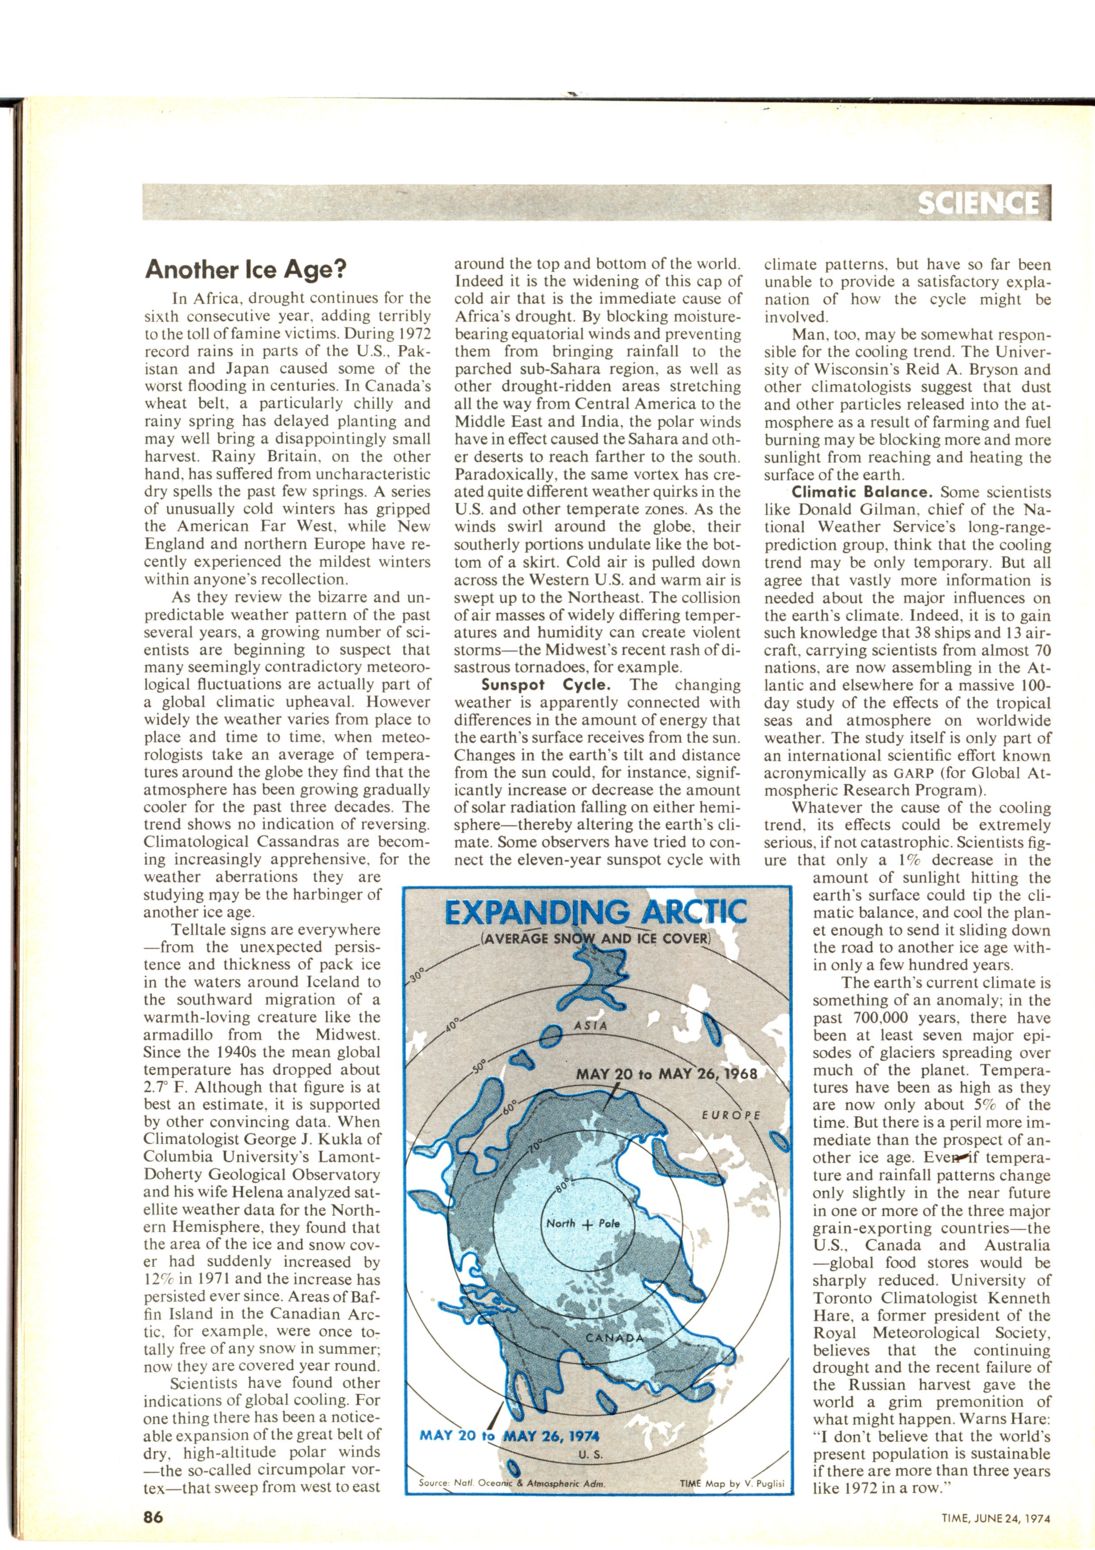
“Another Ice Age?
Monday, June 24, 1974
Telltale signs are everywhere — from the unexpected persistence and thickness of pack ice in the waters around Iceland to the southward migration of a warmth-loving creature like the armadillo from the Midwest.Since the 1940s the mean global temperature has dropped about 2.7° F.”

Page 105 – June 24, 1974, Vol. 103, No. 25 – The Vault – TIME
Wayback Machine
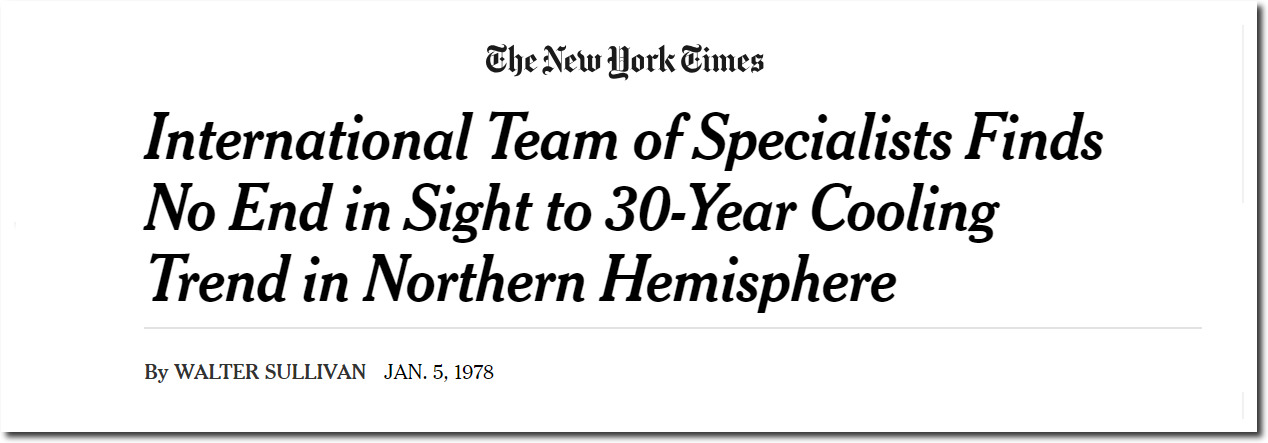
International Team of Specialists Finds No End in Sight to 30 Year Cooling Trend in Northern Hemisphere – The New York Times
The 1990 IPCC Report showed a large increase in Arctic sea ice during the 1970s.

ipcc_far_wg_I_chapter_07.pdf
Never mind all that history, though. NSIDC has “newly available data sets” which show that Arctic sea ice has been declining since 1953.
“April 30, 2007
newly available data sets, blending early aircraft and ship reports with more recent satellite measurements that are considered more reliable than the earlier records, show that the September ice actually declined at a rate of about 7.8 percent per decade during the 1953-2006 period.”


Arctic ice retreating more quickly than computer models project
Since that report was written in 2007, there has been no trend in Arctic sea ice extent.

ftp://sidads.colorado.edu/DATASETS/NOAA/G02135/north/daily/data/N_seaice_extent_daily_v3.0.csv

 Fact Check: Greenland’s Petermann Glacier getting smaller, not growing | Reuters


