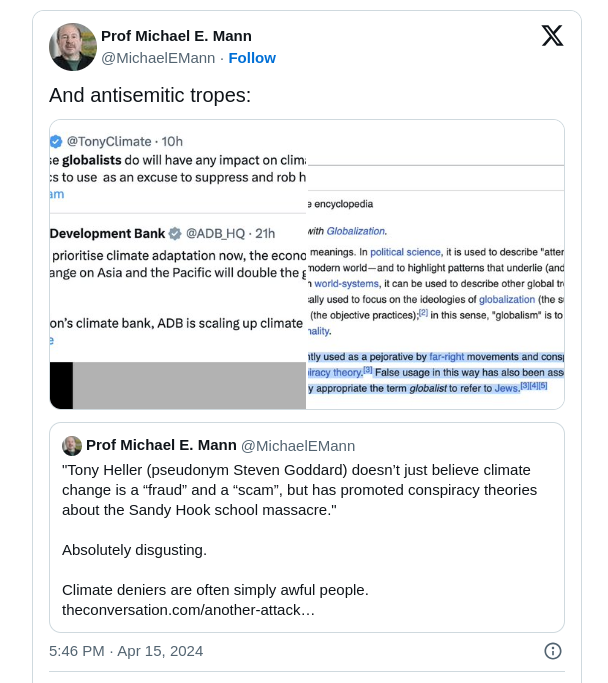
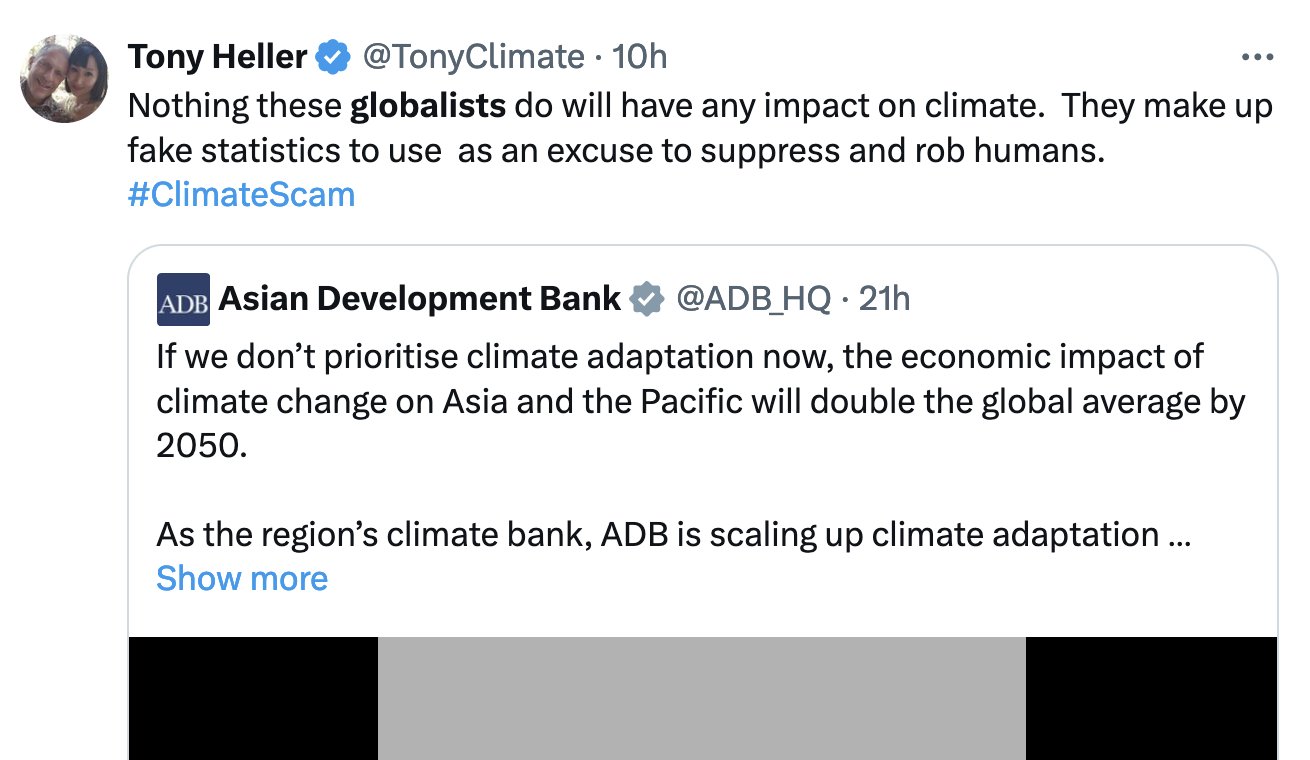
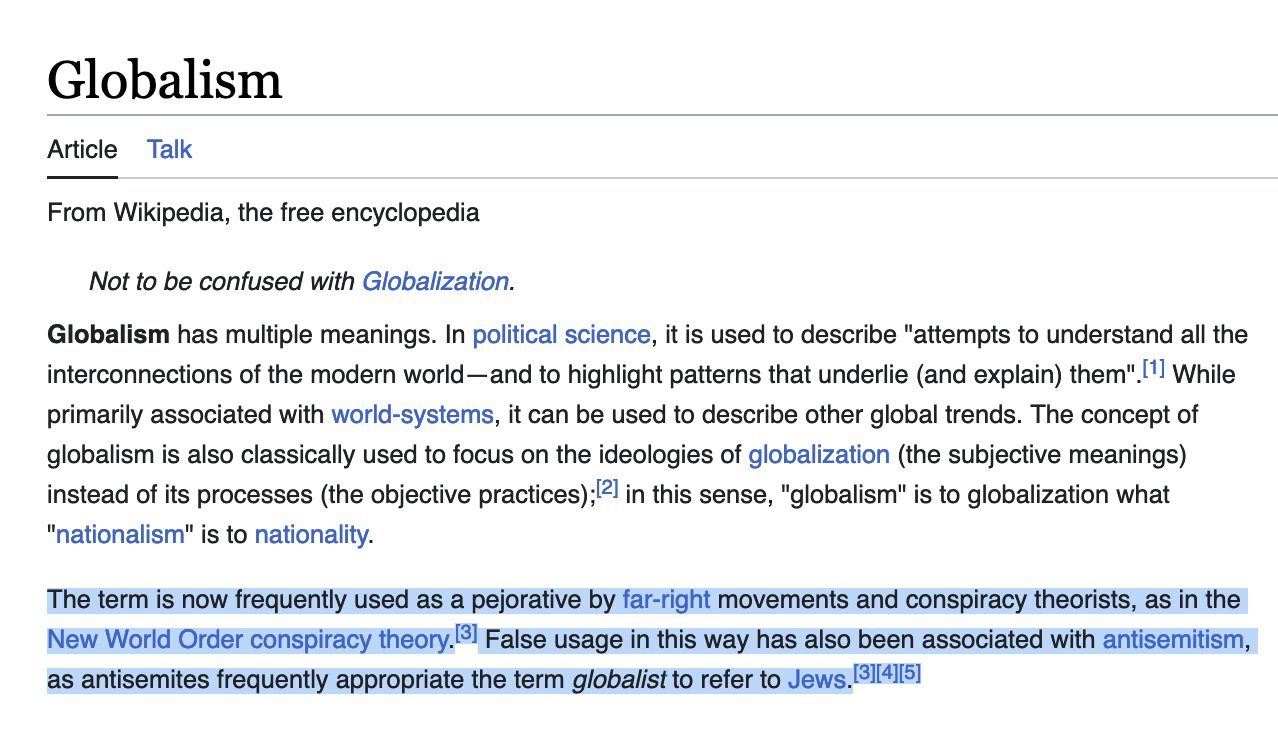
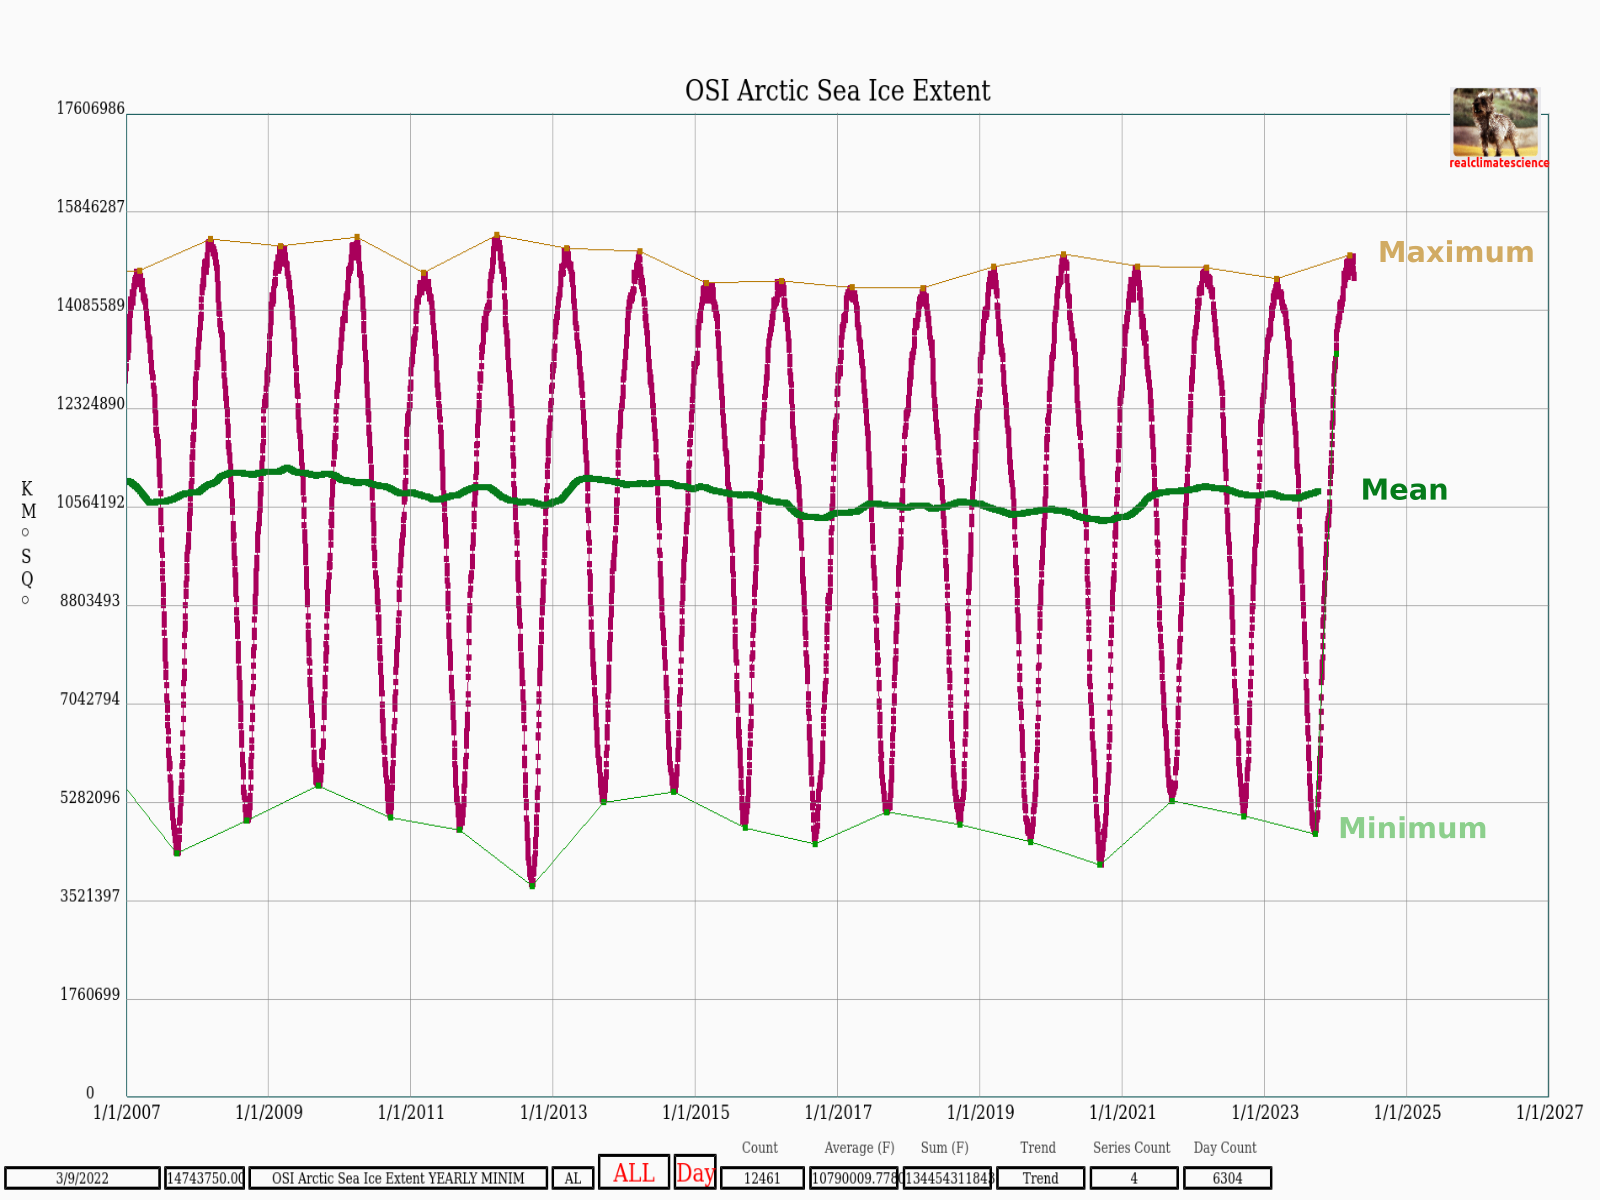
February 19, 1884 Tornado Outbreak

“Middlebury Register and Addison county Journal 29 Feb 1884,

Great Loss of Life in Five Southern States Thousands of Houses Destroyed—Hundreds of People Killed,

The States of Georgia, Alabama, North and South Carolina and Louisiana have been visited by one of the most destructive storms ever seen in the South. Thousands of houses were destroyed in an instant, hundreds of Persons lost their lives, and many more were injured. -The tornado was particularly severe in Georgia and Alabama”

29 Feb 1884, 2 – Middlebury Register and Addison county Journal at Newspapers.com

Posted in Uncategorized | Leave a comment

February 19, 1888 Illinois Tornado

“York Democratic Press 24 Feb 1888, Fri -Page 2 BY CYCLONE AND FLAME.—Tho Town of Vernon, Ils,, Nearly Wiped Out.
AN APPALLING DISASTER!
Tho Loss of Life Estimated at Fully : Forty-Eight.

Whole Families Buried Beneath the Ruins of Their Desolated Homes—Tho Tornado Strikes the Eastern Portion of thee Town and Buildings Are Blown Into Kindlings,

Mount Vernon, IL., Feb. 20.—This city Was visited by a terrible tornado about 4:45 p.m, yesterday. It had been thundering and raining for some time, when suddenly a low rumbling noise was heard and a black dense cloud that seemed to touch the earth swept over the city, and it became very dark. As soon as the cloud passed the sky brightened an people realized the shock and loss they lad sustained. Hundreds of houses were blown down, and ‘many people were crushed in the ruins. It is impossible to estimate the loss at this time. At least half of the town ix in ruins,”

24 Feb 1888, 2 – York Democratic Press at Newspapers.com

Posted in Uncategorized | Leave a comment

1°C Temperature Drop

“Ice Age doomsayers note evidence that average temperatures in the  Northern Hemisphere dropped 1° Celsius during the 1950s and 1960s. Kukla found that the average snow and ice cover in the Northern Hemisphere increased sharply in 1971 compared with the years between 1967 and °70. It reached a peak in ’72 and °73 and then retreated about halfway back to what it had been in the late 60s. Now, says Kukla, satellite studies indicate that the snow and ice cover last fall increased again to about the level of 71. German Oceanographer Martin Rodewald has noticed a slow, general cooling of the waters of the North Atlantic and North Pacific and an airtemperature drop in the Arctic regions over Canada and Russia.

Global cooling might be explained by a link between ice ages and changes both in the earth’s attitude and in its orbit around the sun. That concept was championed by Germany’s Alfred Wegener (best known for his ideas about continental drift) and later refined by Yugoslav Mathematician Milutin Milankovitch, for whom the theory is now named. Last year three scientists —James Hays of Columbia, John Imbrie of Brown University and Nicholas Shackleton of Cambridge University in England—published the strongest evidence yet that Milankovitch was right, Analyzing cores of sediments taken from beneath the floor of the Indian Ocean, the trio assembled an accurate record of the earth’s climate dating back 450,000 years and correlated this information with data about the earth’s orbit,

TIME, JANUARY 31, 1977”

Page 33 – Jan. 31, 1977, Vol. 109, No. 5 – The Vault – TIME

Understanding climatic change : United States Committee for the Global Atmospheric Research Program : Free Download, Borrow, and Streaming : Internet Archive

“Telltale signs are everywhere — from the unexpected persistence and thickness of pack ice in the waters around Iceland to the southward migration of a warmth-loving creature like the armadillo from the Midwest.Since the 1940s the mean global temperature has dropped about 2.7° F. Although that figure is at best an estimate, it is supported by other convincing data. When Climatologist George J. Kukla of Columbia University’s Lamont-Doherty Geological Observatory and his wife Helena analyzed satellite weather data for the Northern Hemisphere, they found that the area of the ice and snow cover had suddenly increased by 12% in 1971 and the increase has persisted ever since. Areas of Baffin Island in the Canadian Arctic, for example, were once totally free of any snow in summer; now they are covered year round.

Scientists have found other indications of global cooling. For one thing there has been a noticeable expansion of the great belt of dry, high-altitude polar winds — the so-called circumpolar vortex—that sweep from west to east around the top and bottom of the world. Indeed it is the widening of this cap of cold air that is the immediate cause of Africa’s drought. By blocking moisture-bearing equatorial winds and preventing them from bringing rainfall to the parched sub-Sahara region, as well as other drought-ridden areas stretching all the way from Central America to the Middle East and India, the polar winds have in effect caused the Sahara and other deserts to reach farther to the south. Paradoxically, the same vortex has created quite different weather quirks in the U.S. and other temperate zones. As the winds swirl around the globe, their southerly portions undulate like the bottom of a skirt. Cold air is pulled down across the Western U.S. and warm air is swept up to the Northeast. The collision of air masses of widely differing temperatures and humidity can create violent storms—the Midwest’s recent rash of disastrous tornadoes, for example.”

Page 105 – June 24, 1974, Vol. 103, No. 25 – The Vault – TIME


Posted in Uncategorized | 6 Comments

A Completely Fake Story

A short video showing how the New York Times starts out with an agenda, and then creates a fictional story in support of it.

Posted in Uncategorized | 6 Comments

The 50 PPM Rule For Data Tampering

For each 50 PPM increase in CO2, NOAA adds an additional one degree of imaginary warming to the US temperature record. They are altering the data to match their failed theory.

Posted in Uncategorized | 3 Comments

The 50 PPM Rule For Data Tampering

In 1999, NASA’s James Hansen was upset that the US temperature graph didn’t match his fake global temperature graph, so NASA and NOAA altered the US temperature data.

NASA GISS: Science Briefs: Whither U.S. Climate?

NASA 1999

And this is NASA’s current graph, which now shows a strong warming trend during that period.

NASA 2019

At first the alterations were small. but then they got much larger.

USHCN ORNL/CDIAC-87 NDP-019

For each 50 PPM increase in CO2, temperatures are adjusted upwards by 1F.

The lack of data from 1895 doesn’t stop NOAA from drawing a very detailed map.

Global Temperature | Vital Signs – Climate Change: Vital Signs of the Planet


Posted in Uncategorized | 9 Comments

Climate Deniers In Wyoming

“state senators hear from climate change deniers”

“last year, Gov. Mark Gordon, who serves as this year’s chairman of the bipartisan Western Governors’ Association, announced his “Decarbonizing the West” initiative”

“There is no challenge I can see that is more important for us to address responsibly, thoughtfully, and, most importantly, honestly, than climate change, and that is what this initiative is about,”

State senators hear from climate change deniers | Local News | wyomingnews.com

Posted in Uncategorized | 9 Comments

Corrupting Uruguay

Uruguay is the only country in South America with good long term temperature coverage. Temperatures at Uruguay haven’t warmed much, so NOAA pollutes them with UHI affected thermometer readings from Buenos Aires.

Posted in Uncategorized | Leave a comment

Celebrating Corruption

Science Magazine celebrating corruption in both science and the legal system.

Passion is not misconduct | Science

Posted in Uncategorized | 14 Comments

Corrupting Uruguay

The long-term temperature record from Uruguay shows little warming, but homogenizing in UHI infected data from Buenos Aires, a strong warming trend is created.

According to NASA, some of the Buenos Aires UHI is removed in the GHCN V4 database by homogenization, but the in the actual database the UHI effect is made slightly worse.

Data.GISS: GISS Surface Temperature Analysis (v4)

Posted in Uncategorized | 5 Comments