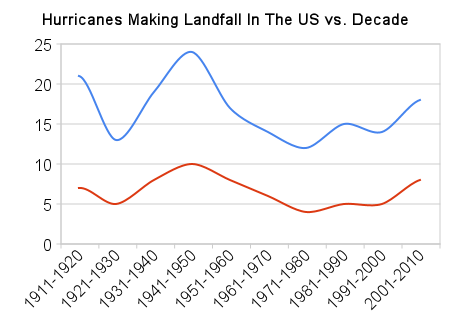
It has been widely reported that increasing CO2 produces more hurricanes. If that were true, we would expect to have seen an increase in hurricanes as CO2 has risen over the last 100 years. The graph below shows US hurricane strikes in blue, and major (category 3, 4, 5) hurricane strikes in red. The current decade is updated through September 3, 2010.
As you can see, the most active hurricane periods occurred over fifty years ago. Now, lets do a direct comparison between hurricane strikes and CO2.
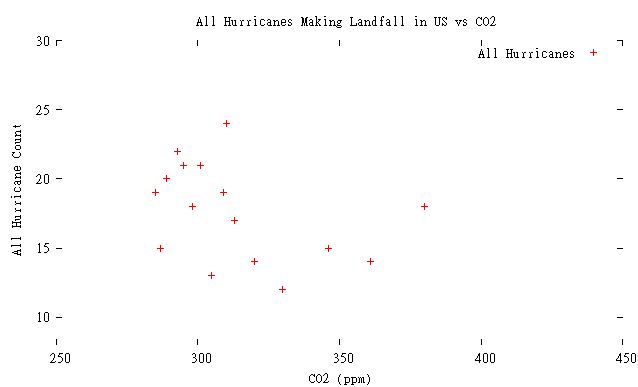
The plot below shows US hurricane strikes (per decade) vs atmospheric CO2. As you can see, the most active decades occurred when CO2 was much lower.
Conclusion: If there is a correlation between CO2 and hurricanes making landfall in the US, it is the opposite of what is predicted. As CO2 has increased, hurricanes have decreased.
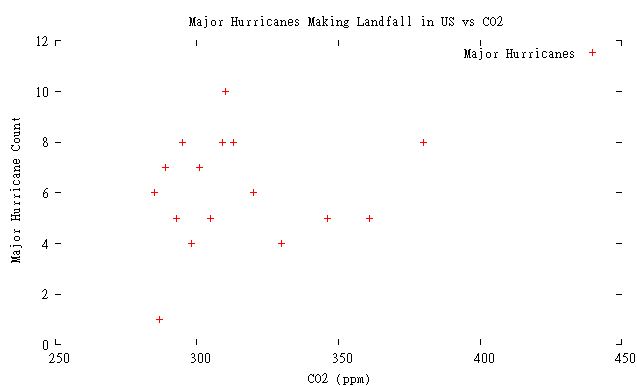
Some of our friends have picked up on this fact and changed their tune. Now they say there will be fewer hurricanes, but more big ones. Again, this is easy to test. The plot below shows the number of major hurricanes (per decade) making landfall in the US vs. atmospheric CO2.
Again, there is no correlation between atmospheric CO2 and major hurricanes striking the US.
The last category five hurricane to make landfall in the US was Andrew in 1992.


Surely it is the total number of hurricanes that form, not just the ones that make landfall?
[Reply: The reason to use landfall hurricanes is that no one ever misses counting them. One hundred years ago, lots of hurricanes in the mid-Atlantic probably went unnoticed.]
Since you go back to 1921, are the early years accurate and if not how are they factored in?
Additionally, on your graph I note a clear upward trend since 1980. Is the relationship between sea temperature rising and the frequency of hurricanes linear? I don’t think it is that simple. There has always been great variation in the number of hurricanes and severe ones therein, with a link to El Nino and La NIna. When can it be decided that there are more hurricanes and/or more severe ones? If I continue the trend of your graph, a couple of decades will suffice. I think that a graph linking CO2 with hurricanes is far to simplistic. There are a lot of other factors at play.
[Reply : I doubt anyone missed noticing hurricanes hitting the US 100 years ago]
Agree, but what is the ratio between hurricanes that make landfall and the ones that don’t? I’m sure that we have much better records than say 30 years ago.Hence it is not possible to say anything definitive about increasing or decreasing hurricanes. There may well be more (not making landfall) but how can we compare it? Only time will tell because the accurate record period is far too short, which applies to both proving and disproving.
[Reply : Excellent paper on this topic here http://www.aoml.noaa.gov/hrd/Landsea/landsea-eos-may012007.pdf ]
I don’t think its hurricanes being missed that one needs to worry about in historical records, rather, I’d think there could be significant chance of hurricanes being counted multiple times from reports at different locations. This would caused inflated historical counts.
And I agree with baffled24, nobody has made the claim that more CO2 causes more hurricane landfalls. On top of that, the current thinking is that increased energy in the form of higher SST, etc will not necessarily cause more storms, but stronger storms.
[Reply : I hear about “greater frequency” of extreme weather all the time. 328,000 Google hits
Steve, science isnt done by Google Searches and what I ‘heard about.’ Unless you take the 289,000,000 Google results for ‘the earth is flat’ as truth.
[Reply : Science is done by Al Gore and Joe Romm]
0 of 3… try again…
Thanks for the link, I’ll read it this weekend.
There is plenty of peer-reviewed studies that indicate CO2 levels and severe weather events (including hurricanes) is a fairly lame proposition. Now, if someone wants to surmise that global cooling causes more severe weather events, the evidence would seem to agree.
See this page for a listing of various studies:
http://www.c3headlines.com/are-droughts-floods-more-frequent/
Oops -1 for me too… should have read 0 for 3.
[Reply : Al Gore did share the Nobel Prize with Pauchuri for their outstanding efforts to educate the public on these critical science issues]
Yeah but he didn’t do any of the science. Neither did journalists or politicians or google or blogs.
Oh, just a quick suggestion — I don’t get a new message notification from WordPress when you do the replies as you’ve been doing. It might be helpful for those who want to respond if you do a standard reply so that commenters are notified of a reply.
[Reply : Is there a “Notify me of follow-up comments via email.” check box visible when you post?]
Surely no relationship between C02 and frequency or severity, but if the chart is accurate, there may be a relationship between SST and both of them. And it’s a further indicator that true energy in the system may never have rebounded to the level of the 30s/40s.
baffled24 Says:
September 3, 2010 at 2:03 pm
Steven, I have read the paper and it raises more questions than it answers. It only served to strengthen my opinion that the graph is a too simplistic representation of the whole picture. In view of the variables I see no clear cause and effect. La Nina normally sees an increase of hurricane activity and that seems to be happening right now with a sequence of a hurricane, followed by a tropical storm, followed by a tropical depression, followed by a potential area. How many will become a hurricane and make landfall? No one knows but surely if more storms form, more will reach land. As I said, another decade or two will settle the CO2 v hurricane argument. CO2 raises SST’s and hurricanes require among a number of conditions, a surface temperature of 27 C plus. Hurricane formation is chaotic enough to defy a linear response. Any direct comparing of frequency and CO2 levels ignores complexity.
Steve – yeah, there is, and I get all updates from other posters, just not yours.