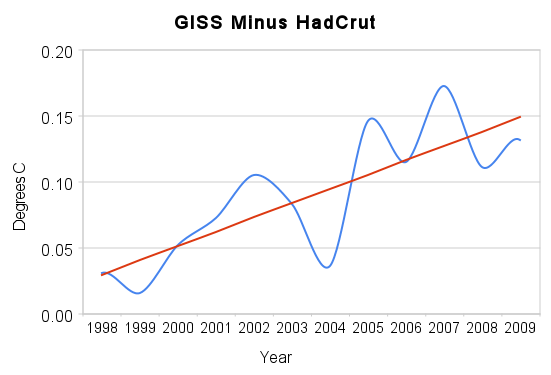
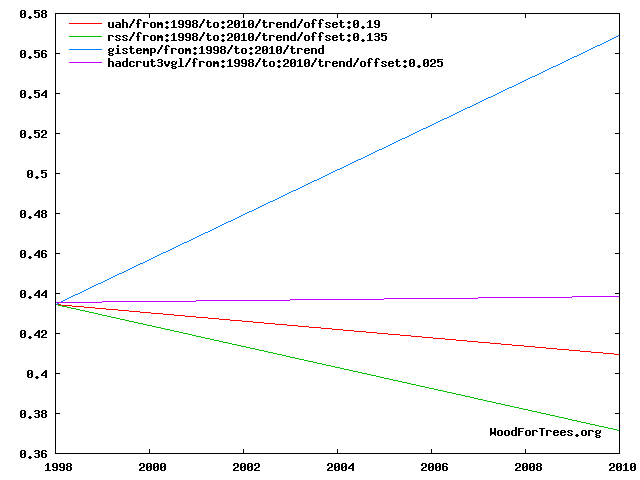
Since 1998, GISS and Had Crut annual temperatures have been diverging at a rate of about 1°C per century. The graph below shows the normalised trends for GISS, UAH, RSS and HadCrut from 1998-2009.
GISS shows warming from 1998-2009. Everyone else shows flat or slight cooling.


