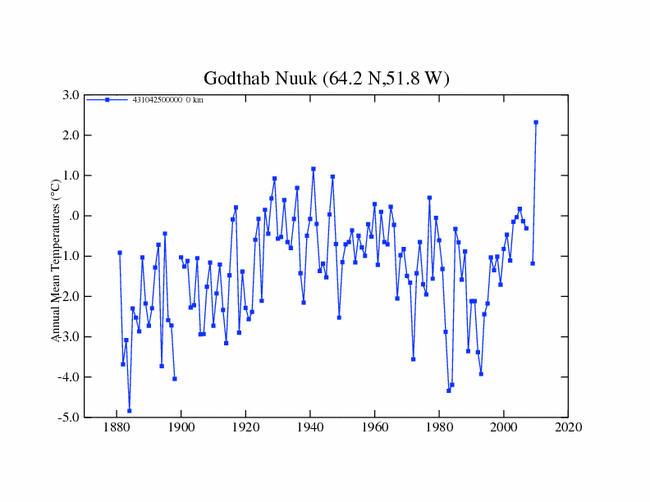
Someone at GISS appears to have a sense of humour. The graph above shows annual average temperatures (not anomalies) for the capital of Greenland. It looks like 2010 is by far the warmest year on record.
Most people displaying this type of information would be sensible enough to wait until the end of the year to calculate an annual mean. Obviously the January-August mean temperature is going to be much higher than the January-December mean. The 2010 data point should not appear on the graph until 2010 is over.
—————————————————————————————————-
Please address scientific inquiries about the GISTEMP analysis to Dr. James Hansen.


“It’s better than we thought”
Being a regular visitor to the Channel Islands I quite like GISS Guernsey Airport record.
http://data.giss.nasa.gov/cgi-bin/gistemp/gistemp_station.py?id=651038940000&data_set=1&num_neighbors=1
I can only assume that the Wright Brothers had 20 years of test flights at Guernsey Airport before crashing in 1900 and taking the Stevenson screen with them.
I just looked through the public data of GISS, checking temperature graphs around the world. For a whole lot of them there is already “2010” temperatures. Huh. I guess the idea is to put the thought in peoples’ heads now, change the data later, and go with the fact that people will not recognize the change.
So in the big top circus of climate science, GISS plays the role of the clowns pouring out of a little VW.
Does the GISS database have a 2010 value for locations in the southern hemisphere yet? If not, I’d say that’s 100% solid proof of a bias. If they do have those numbers up, it’s just evidence of bad protocol. 😉
-Scott
Well it is one way of ensuring that each year is the hottest year on record.
Something else worth noting is that the number of dropped months has gotten worse not better:
1880 – 1889 15
1890 – 1899 0
1900 – 1909 4
1910 – 1949 0 (40 years)
1950 – 1959 7
1960 – 1979 0 (20 years)
1980 – 1989 1
1990 – 1999 3
2000 – 2009 18 *
In 2003 they missed 3 consecutive months but somehow were able to come up with a yearly arerage to within a hundredth of a degree.
* To state the obvious, the incomplete 2010 is not in this figure.
Pingback: Sea Level Falling In 2010 | Real Science
Pingback: Watts Up With Nuuk? | Watts Up With That?
It begins to look like an old Stalinist saying: You can vote what you want, it is who counts the votes what counts. In measuring terms this may translate in what ever temperature you measure it is those who average are what counts.
Pingback: Sea Level Falling In 2010 | NW0.eu
Pingback: More Fun In Nuuk | Real Science