Santa’s Workshop is looking cold and dark
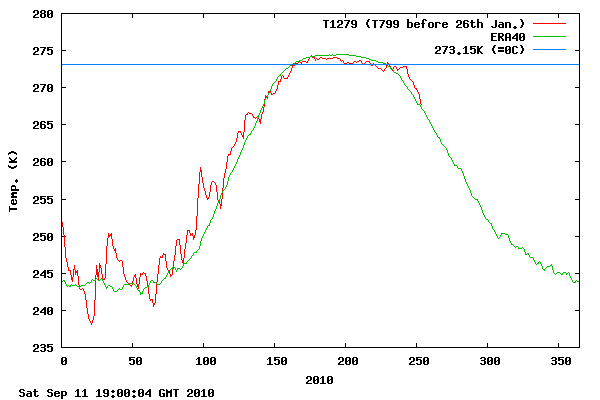
After a month of above normal temperatures, the weather has turned cold in the high Arctic again. Temperatures north of 80N have dropped to about -5ºC, which is near normal.
http://ocean.dmi.dk/arctic/meant80n.uk.php
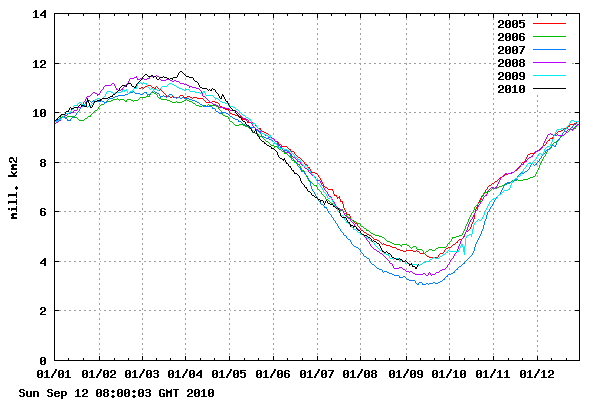
This is causing new ice to form, which is driving the 30% concentration extent numbers upward.
http://ocean.dmi.dk/arctic/icecover.uk.php
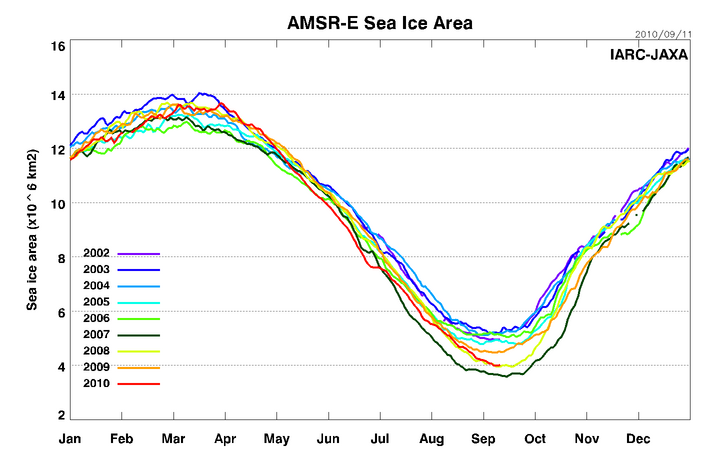
Similarly, ice area may have bottomed, as areas of open water near the pole begin to freeze.
http://www.ijis.iarc.uaf.edu/seaice/extent/AMSRE_Sea_Ice_Area.png
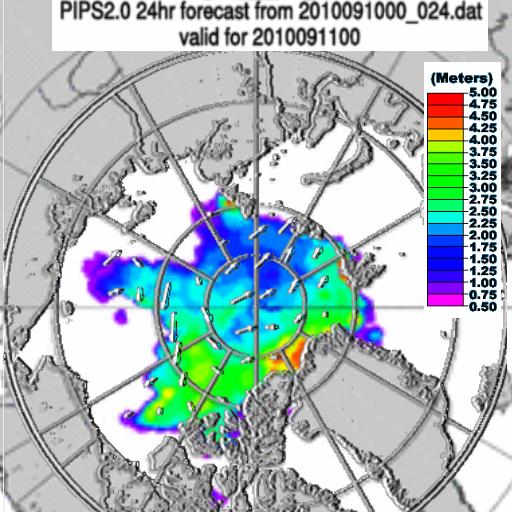
PIPS hasn’t updated their maps for two days, but the most recent map shows that the southerly winds which pushed back the ice edge over the last month have also stopped.
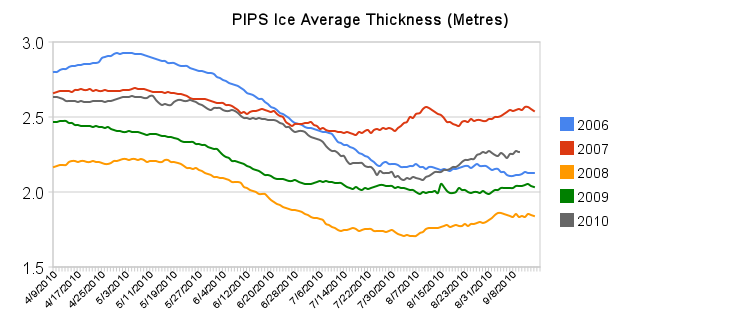
PIPS maps show average ice thicknesss and ice volume the highest since 2007.
Modified NSIDC maps from March and late July show similar data about ice age. Multi-year ice (MYI) is defined as ice which has passed its second birthday. The blink comparator below shows actual March 2010 MYI vs. potential 2011 MYI – indicating a significant potential increase in MYI over the winter. “Potential” assumes that all end of July MYI and 1-2 year old ice survives. The actual amount of MYI next spring will be less, because of summer melt since July and winter winds which drive ice out into the North Atlantic.

Julienne Stroeve from NSIDC commented here this week :
Through the end of August, today the Arctic has the least amount of ice ages 4+ than we’ve seen in the satellite data record. There is more 2nd and 3rd year ice though than 2008, quite a bit more.
The surviving three year old ice will become four year old ice during the winter, so we can expect to see another increase in the amount of MYI and 4+ ice next spring. By all traditional definitions, this is what is known as a “recovery.”
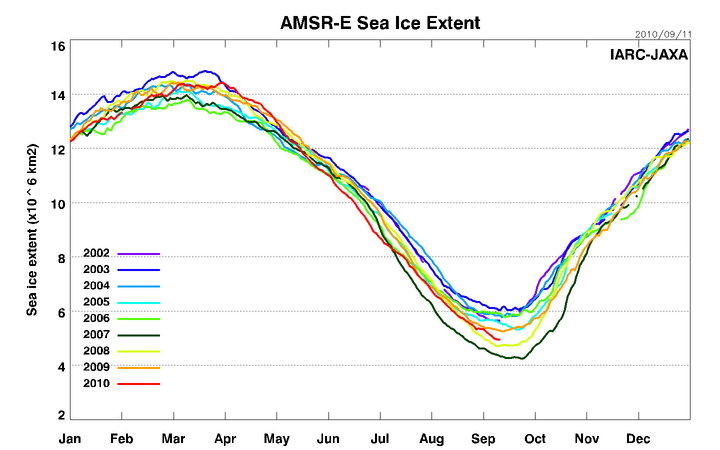
30% extent appears to be headed back up, and it is possible that 15% extent has also bottomed.
http://www.ijis.iarc.uaf.edu/seaice/extent/AMSRE_Sea_Ice_Extent.png
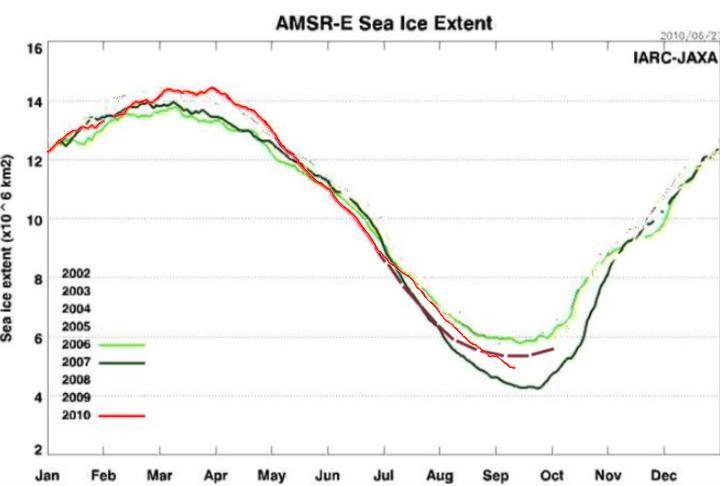
The image below shows the 9% error in my June forecast of 5.5 million km². Ice may have bottomed out at 5.0 million km², rounded to 0.1 forecast precision.
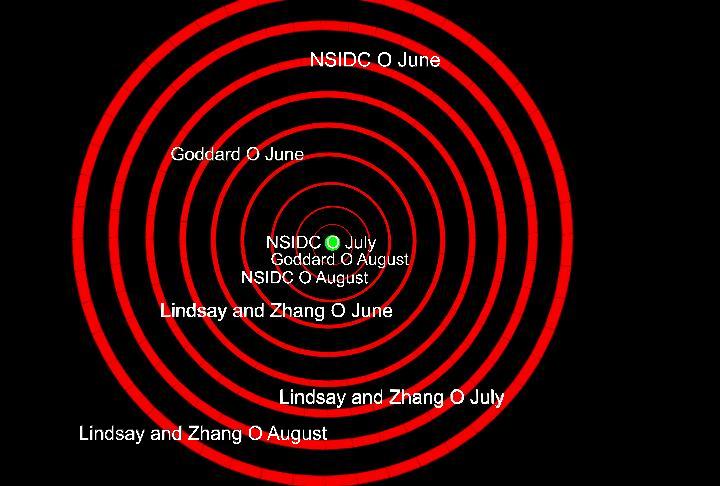
The target below shows (possibly) final scores in ice forecasting. My errors are vs. JAXA and others are vs. NSIDC. (NSIDC reports considerably less ice than JAXA.) Each ring represents 100,000 km² error relative to the author’s chosen measurement system.
If NSIDC extent numbers are accurate, then their July forecast was also the most accurate.
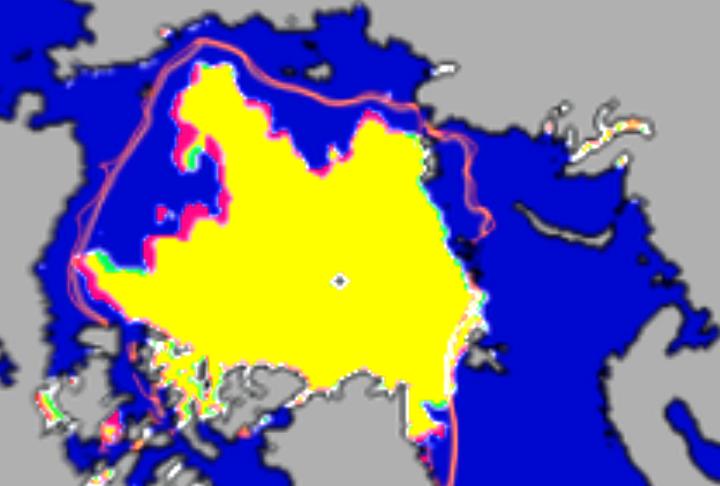
The modified NSIDC map below shows ice loss over the last week.
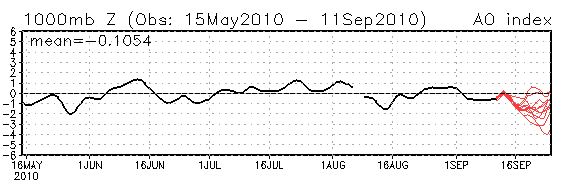
The Arctic Oscillation is forecast to go deeply negative again, hinting at continued recovery of Arctic ice and another cold winter.
http://www.cpc.noaa.gov/products/precip/CWlink/daily_ao_index/ao.sprd2.gif
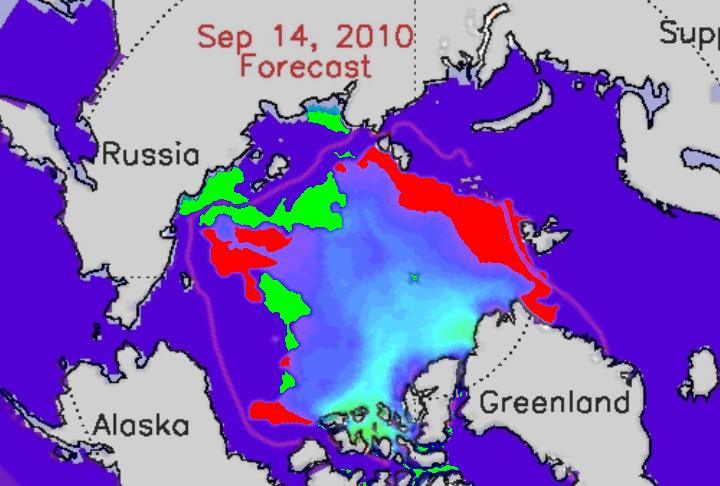
The map below shows final forecast verification for PIOMAS. Red areas are where they overpredicted ice loss, and green areas are where they underpredicted ice loss.
My forecast: Despite the apparent increase in ice age and thickness, people with an agenda to push will focus on the least meaningful of all the statistics – i.e. 15% concentration ice extent.


By all traditional definitions, this is what is known as a “recovery.”
Bravo, well-spun. 🙂
There’s nothing like weather to wreck havoc on climate or early season forecasts.
Leon,
What percentage error would consider to be a “correct” forecast?
Anything within a couple hundred thousand kilometers (your Aug pick) is a bullseye. And as you note, the least important metric is the extent. Weather could turn on a dime anytime, compacting the ice a great deal one year and the next, spreading it out. This looks to be what happened toward the end of August and the first week of Sept. If it hadn’t been for that little surprise, your early forecast (June) would have been pretty close.
As it is, since yesterday the extent’s already increased by 34,000 km². If it holds then the next couple months will be interesting to see how quickly the ice reforms. After that, the Feb/Mar period will be interesting to see what kind of max is reached.
(Personally, I was rooting for an extent greater than 5.5 mil km², but the May/Jun contraction was a bit more than I expected. Oh well, it’s just ice.)
Couple typos in the same sentence:
“ic eloss” should be “ice loss” and the first “the” should be “they”.
Yesterday’s JAXA number showed the largest gain before Sept 12 in the JAXA record. Both area and extent have essentially flatlined (net very small gains) at Cryosphere Today for the last 4 days.
-Scott
I predict that Spring 2011 will see an increase in the proportion of first-year ice over this year, as announced by NSIDC in April, that their interpretation will be that the ice cover is “thin and vulnerable”, and that there will be opposition to that interpretation on this blog. That will prevent us from getting to Spring 2016 and arguing over the meaning of the observation by the NSIDC that there is nearly no ice 10 years old or older, and that the ice is weak because it consists of “relatively thinner 1 to 9 year old multiyear ice”!
You omitted the estimate of R Gates from your target figure (4.5 M) which was, alas, fractionally closer than your 5.5M figure – GUTTED!
Seriously though, your figure on PIPS ice volume (pixel-meters) is important and indicates that the Arctic ice minimum was 2008, not 2007; and that since then we have the second year – on – year recovery.
2011 is indeed shaping up to be interesting.
Hi Steve,
I was wondering if you would be willing to make the PIPS volume numbers available for people to work with. At least an average for each month? Also, do you have years from before 2006?
If I have time this NH winter, I was going to try to prep a multiparameter method for predicting final extent (for next year) and was considering have that as on of my parameters.
Thanks,
-Scott
Sure, My spreadsheet is here. Not much documentation at this point.
https://spreadsheets.google.com/pub?key=0AnKz9p_7fMvBdHlBZHVWa01OSGRHQ0d2S0ZnSTJCNVE&hl=en&single=true&gid=0&output=html