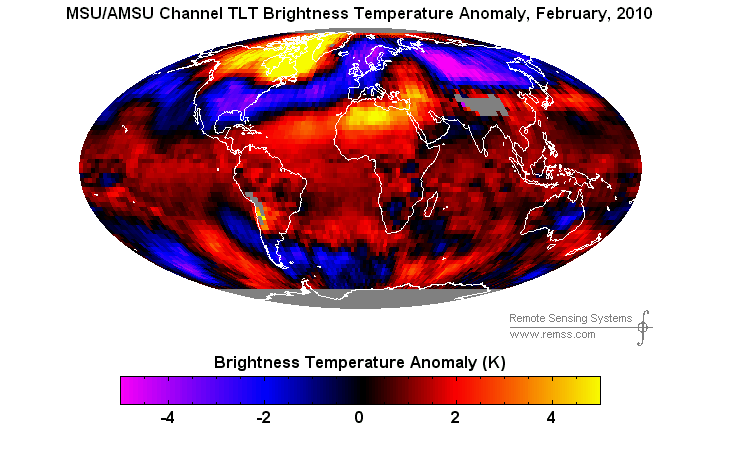
Correction : reader John Finn has pointed out that GISS recorded February as the second hottest February ever, not the hottest.
—————————————————————————————————
February, 2010 was a very cold month across the US, much of Europe and most of Russia and Mongolia. It was the fourth snowiest month on record in North America (out of 517 months) and the eighth snowiest month on record in the Northern Hemisphere.
GISS shows it as the (second) hottest February on record. Why?
Mainly because temperatures in the Canadian Arctic were not quite as cold as normal. Note the “hot spot” on the RSS map above. For example, Alert averaged a balmy -22ºF (-30ºC) compared to last year when it was a frigid -27ºF.
A large percentage of the humans on the planet were freezing in near record cold, yet it was the hottest February ever.
No doubt the Polar Bears were sweating though in that -30ºC weather in the Canadian Arctic.


Anecdotes vs. statistics—it’s an interesting topic to contemplate. How can we believe the numbers when we feel something contradictory? Humans can barely detect a temp change of a few degrees over a few short minutes (let alone guess the actual T), but feel they can accurately tabulate the temperature changes over minutes, hours, days, weeks of years past with great certainty from memory alone.
Hot and cold are human feelings being projected onto this data, which isn’t even absolute degrees C, though they are measured in that. They are anamolies. Anomaly doesn’t appear on this page in the text before now.
February is dead of winter in the northern hemisphere, but high summer in the southern. It’s easy to forget there’s the whole half of the world experiencing the exact opposite as you; day/night, winter/summer, spring/fall. Positive anomaly in middle of cold winter, still cold. Positive anomaly in middle of hot summer, still hot, possibly hotter. On average, 2/2010 is only 0.75C above baseline, though it is still cold in Canada then.
Brightness Temperature Anomaly
Brightness Temperature Anomaly
The word anomaly appears twice. The audience here is quite well educated and fully understands what an anomaly is and what I am talking about.
I think your point is well made, obviously weather outside the U.S. is not relevant. There needs to be a special GISS for parochial consumption. Keep up the good work! And thanks for clarifying what the first comment meant!
Did we annex Russia, Mongolia, and Northern Europe?
Cool!
GISS shows it as the hottest February on record. Why?
According to your link, GISS shows it as the second hottest February on record.
UAH and RSS also show Feb 2010 as the second hottest on record.
Thanks for noticing that – the article has been corrected.
My point—images are not text. Do a text search for the term to understand what I’m saying.
I find it interesting that I live in what is considerd to be the sunniest city in Canada, Medicine Hat Alberta, and the temperature map that they showi definitely dose not reflect what I remember for the month of February this year. I find it very strange that the http://climate.weatheroffice.gc.ca/climateData/canada_e.html , Canada’s official weather archive provides almost no information about any requested February year. What little information I was able to find shows that the mean temp for February last year was -10.7 degrees Celsius with a max temp of -5.4. Interestingly that was colder than the previous year. http://climate.weatheroffice.gc.ca/climateData/almanac_e.html?timeframe=4&Prov=XX&StationID=44746&Year=1992&Month=2&Day=1 . I find It hard to believe that this last February was the 2nd hottest on record when the hottest day recorded for February was February 27, 1992 with +21.1 degrees Celsius http://climate.weatheroffice.gc.ca/climate_normals/results_e.html?Province=ALTA&StationName=&SearchType=&LocateBy=Province&Proximity=25&ProximityFrom=City&StationNumber=&IDType=MSC&CityName=&ParkName=&LatitudeDegrees=&LatitudeMinutes=&LongitudeDegrees=&LongitudeMinutes=&NormalsClass=A&SelNormals=&StnId=2273&autofwd=0 . I distinctly remember that day for it was my first year in college and I was at a party that night and after sitting around out side on the deck for hours in shorts and t-shirts, we finally decided to hop in the hot-tub at 3am, not because we were cold, but because we were bored. There definitely was no short and t-shirt weather hear last year.
You’ve got to love the way those guys colour their charts
OK, now isn’t this also the region where very few remaining reporting weather stations are? And from memory, wasn’t one of those few left after the sudden near 75% reduction (from ~6,000 to about ~1,500 about the year 1990) of reporting weather stations and it was in what is referred to as the “garden spot of the Arctic”?
Haven’t we been here before? Could this be the result of ubergridding, mathematical grid cell calculations from very few regional data points?
Just curious if anyone might want to plot the actual reporting stations in the “hotspot” to better see where the warm data comes from…..