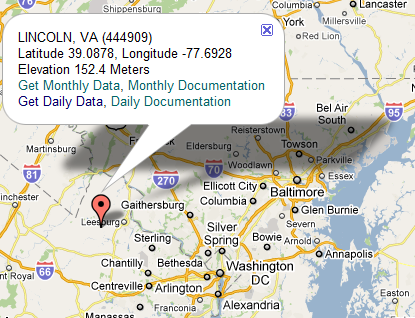
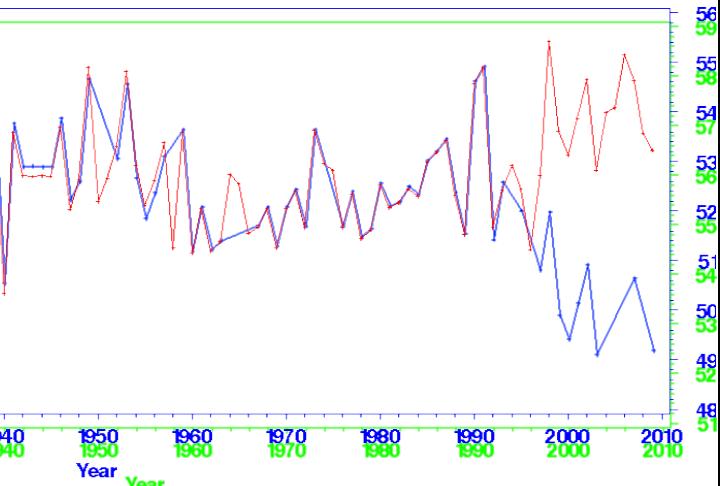
The closest USHCN station to Washington is at Lincoln, Virginia. Since the mid-1990s, the thermometers say that Lincoln has cooled about three degrees (blue below) – while USHCN carefully adjusts the temperatures in the opposite direction. Note that the adjusted (red) trend is up by two degrees since the mid-1990s.
Thanks to the excellent work of our top scientists, we can actually reverse the naughty behaviour of anti-science thermometers.


Gotta love that adjustment in the late 50s that amounts to about 2 degrees down. Wonder what the rationale for that adjustment was, or if it can be justified.
Probably just missing data.
So is any rationale available as to what these temperatures have been adjusted upward?
It would be interesting to see what percentage of stations have been adjusted up, and what percentage have been adjusted down. ;^)
What happened to Brendon and ChrisD, I miss the humor of them defending this kind of adjustment while saying your “cherry picking”.
They just managed to increase Steve’s number of “hits” and he is already more popular than any of their sites, so it was totally unproductive… 😉
So, shouldn’t there be some “footnotes” attached to the data, explaining why revisions were made? Is anyone in government climate accountable for anything?
Denis:
That type of thing is only done by real scientists!
Do they actually publish both series without explanation?I’m just curious, where the adjusted numbers appear. Thanks for the excellent sleuthing!
No, there is no specific explanation given per site
I was employed by NOAA National Weather Service for 35 years. My last 12 years (ending 1986), I was over the Southern Region’s Data collection, archivial and publication of Climatic records for 10 states, Puerto Rico and the U.S. Virgin Isles. Every decade, normals, means and extremes are computed for the past 30 years. 2010 is the year for these averages to be determined and published. It will be interesting to see how the changes have trended.
Hilarious post and damning of the falsification of temperature data by USHCN. I don’t have the time, but someone might want to look at E.M. Smith’s foray into the data banks (chiefio.wp.c). He has the goods on all the fraudsters. Thanks, Steve.
Will FOI requests for raw data and the rationale for adjustments be successful?
Do you think the Republican majority in the H of R will demand a full inquiry into the Hansenised data sets as they seemed to suggest?
I’ll keep my fingers crossed but not hold my breath.
What am I missing?
Scan video to 3:15 and play to 4:10
http://www.youtube.com/watch?v=4WgsTSi4caM
Wow, a sample size of one disproves all of climatology?
Des:
One example of many that are available all over.
Climatology disproves climatology by the quality of their research which obviously appears to be designed to support a previously determined result.
You do realize the IPCC was formed with the purpose of providing evidence that humans are the primary cause of climate change. All other outcomes are ignored as they do nor fit the program.
It only take one experiment to invalidate a scientific theory.
It has to be a valid, well constructed experiment whose results are accurately recorded.
Taking one graph from one place and saying “OMG Global warming is a lie al gore lied to us all!” doesn’t cut it.
You have totally missed the point.
Steve is not cherry picking one site where temps have decreased. He is highlighting a site where the temps have been artificially increased without any justification.
We know that this is quite a common phenomenon world wide so it is not unreasonable to expect GISS and co to justify what they have done before they can expect us to accept their conclusions.
There are many instances of undefended data manipulation – almost on a weekly basis. All causing warming, of course:
Here is one in Australia – just today.
http://joannenova.com.au/2010/11/australias-high-quality-data-12-year-sites-used-for-long-term-trends/
One in Australia from few week ago:
http://joannenova.com.au/2010/10/bom-giss-have-record-setting-bugs-affecting-a-million-square-miles/
In New Zealand
http://nzclimatescience.net/index.php?option=com_content&task=view&id=554&Itemid=1
In New Zealand, sceptics took NIWA to court over falsifying the record – and their defence? – (i) We lost the adjustments and the reasons for them so we can’t produce them, (ii) we do not have a responsibility to keep accurate temperatures – the graphs were for our internal use.
Think about it – after $trillions spent worldwide on Climate Alarm and green industry, if Climate alarm turns out to be grossly exaggerated – name one person who would go to jail. With Maddof, I am aware of only him going to jail, everybody else who made millions selling the stuff cried they were “hoodwinked victims”. If AGW is a scam, it will be a perfect green-collar crime.
Steve,
Love your new blog.
I am curious about the scales of the two graphs, particularly the parts prior to 1990 where the data points appear to line up. In the raw data it shows 1991 a little over 58F. In the adjusted data it shows the same data point at around 55F. It seems that prior to the early 90’s everything was adjusted down by 3F. After then it’s anybody’s guess.
MrC
The scales on the graphs are the same, but they did a huge shift along the y-axis
Steve, does that mean that there is an overall adjustment over all years, but a larger (and possibly increasing) adjustment to data since 1990?
We have the same prob in my country.
Thermometers show no warming.
“Official” adjusted figures show alarming warming.
When asked in parliament to justify the adjustments- Not un-reasonable I would say.
Well watch this video.
http://www.youtube.com/user/inthehousenz#p/u/2/Roku_QeiE3s
Cheers
Roger
http://www.rogerfromnewzealand.wordpress.com
PS. there is a private prosecution through the courts progressing at this moment.
http://www.climateconversation.wordshine.co.nz/2010/10/observations-on-niwas-statement-of-defence/
There is a data package available at http://www.ncdc.noaa.gov/oa/climate/research/ushcn/ushcn.html and some contact details etc. The adjustments are included in the data package.
Some 20 years ago, the National Weather Service (NWS), reorganized the data collecting process all over the U.S They abolished all dedicated positions which were responsible for maintaining the cooperative networks, and gave the responsiblity to Hydrometeorological Technicians HMY) as a secondary job. Thse positions are not schooled nor trained in various equipment types, data collection, archiving and publication requirements. Likewise, the National Climatic Data Center (NCDC) eliminated validators that processed the raw data prior to key punching the data for publication. Now raw data are going into the database without any overview. Also, any and every type of weather equipment is being published regardles as to accuracy, whereas in the past, data could only be published if it had been tested with standard equipment from one to two years. Much questionable data are are now corrupting our national database.
Here’s a better link to the actual data http://cdiac.ornl.gov/cgi-bin/broker?_PROGRAM=prog.climsite_monthly.sas&_SERVICE=default&id=444909
You have to rig things when your trying to make the panic of 1524 again
http://www.museumofhoaxes.com/hoax/Hoaxipedia/Medieval_End_of_the_World_Hoaxes/
Pingback: More USHCN Comedy in D.C. | Real Science
Des – I don’t think anyone is saying that one data set disproves anything. That is a classic straw man argument – misstating and exaggerating the opposing point of view to make it absurd. I would be interested to know whether we can (or should) trust the data collected before the introduction of the thermistor based sensors. If the modern thermistors read low compared to the old devices, I would think you would trust the thermistors, and then go back and adjust all the old data points downward. It just seems odd to me. When Mann came up with his “nature trick” to “hide the decline” he was doing the opposite – throwing out the proxies showing low temps that did not conform to the data that from modern equipment, which was presumed to be more accurate. He ignored proxies that showed lower temperatures. In this instance the modern gear is showing lower temps, so it is adjusted upward. So, if you toss the proxies when they are too low, and adjust the modern digital data upward when it is low, doesn’t that suggest that there could be a systemic bias towards upward adjustment? I know we are talking about different data sets and different organizations, and I am not suggesting a conspiracy. I am saying that I have yet to read of any example where high temps were ignored or adjusted in favor of lower temps.
As evidenced by Des’ comments, the left cannot accept the eveidence, no matter what. East Anglia shenanigans – not to worry; NASA JPL deferring to E. Anglia’s fallacious reports – but of course; new evidence of tinkering with data – just an anomoly (without explanation), not a problem. It’s incomprehensible.
Pingback: Latest Global Warming news - Page 20 - theBubbler
GISS claims they are just using NOAA and CRU data to arrive at there results and CRU claims they are using NOAA and GISS data with a bit extra thrown in and they all seem to be using the “Quality” data from HADCRU SST version whatever with the latest SWAG estimates! Independent Global data sets appears to be an Oxymoron like Politically Correct. There is little to nothing “correct” in politics. The most plausible liar wins the election.
They have probably adjusted because the lack of Sun Spots has allowed more cloud formantion & Volcanic dust which shields the sun causing an unplaned unscientific global cooling:>))
Her is a little clue. I am a gardener and I live on the Washington Coast. The number of growing days Has been declining for the last four years. It takes warmth to grow vegetables. If that is uniform across the northern hemisphere that means less food production. I wonder if I can find the Canadain annual wheat production records. Does anybody have clue where to find them?
Pingback: Climate Scandals – List Of Gates Balloons To 129!
Pingback: Climate Science Scandals – List Of Gates Balloons To 129!