Kiribati is asking for “climate change mitigation funding” from stupid westerners this week, because sea level is rising there at a rate of six inches per century.
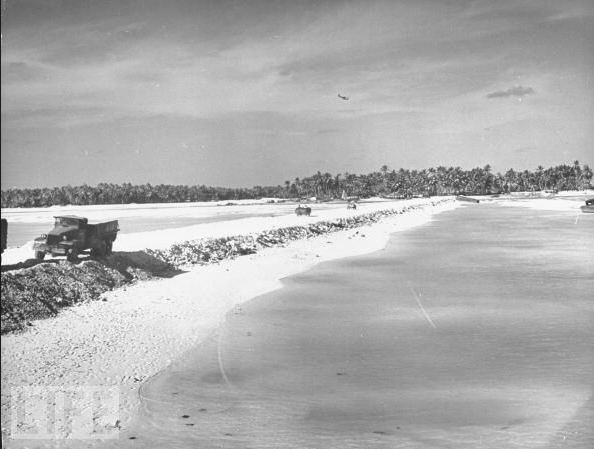
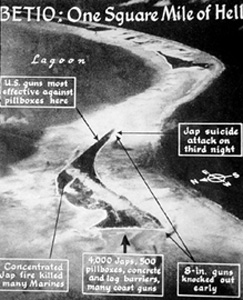
Below are some pictures showing what Kiribati looked like in the 1940s.
Tarawa, was a World War II battlefield whose coral and sand landscape was turned into a charred crisp that resembled something like a lunar surface by Allied and Japanese forces.
http://www.bigempire.com/sake/kiribatiwwii.html

KIRIBATI – MARCH 1944: US Army Engineers’ causeway built out of coral to connect the many islands of the Tarawa Atoll.


It would be interesting to see pictures from the same angles today. From satellite photos (google maps) Betio looks a little larger today.
Anyway, IF the sea level continues to rise, coral atolls will rise with it…
I’m not convinced that sea level is rising by a measurable amount.
http://tidesandcurrents.noaa.gov/sltrends/sltrends_station.shtml?stnid=1840000
Some portions of the islands may be sinking though. Probably due to the extra weight of CO2 in the atmosphere.
The portions of the islands that are sinking would be those that were built up by the ACOE during the war. They dredged sand and coral from the sea to accomplish the building and natural erosion would return that sand to where it was removed from over time. Land use, land change has more of an impact on land shape than CO2. Especially on atolls in the pacific.
Removal of ground water will also have an effect on land shape.
well, mike nothing to argue about with that!
Hmmmmmm………….. me bad again. I’m writing up a report at the moment where I am incorporating some C14 dating on stumps in their natural growth position (in-situ) submerged below the HHWL. Both isostatic and eustatic sea level changes are pretty clear in Maritime Canada…. the rate in southern Nova Scotia being about 1/3 m or a foot per 100 years. About 1/2 of this is land subsidence as the peripheral crustal bulge collapses northward toward the centre of the Laurentide ice sheet and southern – central Nova Scotia is now on the back side (subsiding side) of the bulge. The rest is sea level rise vs subsidence. A great picture taken by D. Grant, Geological survey of Canada. shows the mooring rings at the French Fortress of Louisbourg from the 1700’s, below the HHWL representing the 1 foot net per year of total eustatic and isostatic effects. Really neat, I dated a stump from 3070 C14 years that is around 1400 – 1200 YBP, right at the height of the pyramid building in Egypt. Has nothing to do with sea level but still, really neat.