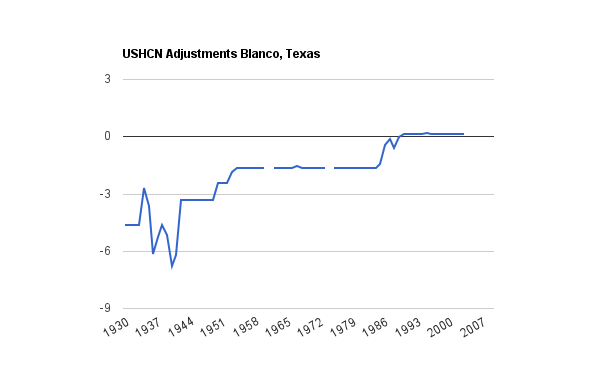
USHCN has adjusted 1930s maximum temperatures in Blanco, Texas downwards by more than six degrees. Nice way to turn a pesky cooling trend into a warming trend.
Disrupting the Borg is expensive and time consuming!
Google Search
-
Recent Posts
- Gaslighting 1924
- “Why Do You Resist?”
- Climate Attribution Model
- Fact Checking NASA
- Fact Checking Grok
- Fact Checking The New York Times
- New Visitech Features
- Ice-Free Arctic By 2014
- Debt-Free US Treasury Forecast
- Analyzing Big City Crime (Part 2)
- Analyzing Big City Crime
- UK Migration Caused By Global Warming
- Climate Attribution In Greece
- “Brown: ’50 days to save world'”
- The Catastrophic Influence of Bovine Methane Emissions on Extraterrestrial Climate Patterns
- Posting On X
- Seventeen Years Of Fun
- The Importance Of Good Tools
- Temperature Shifts At Blue Hill, MA
- CO2²
- Time Of Observation Bias
- Climate Scamming For Profit
- Climate Scamming For Profit
- Back To The Future
- “records going back to 1961”
Recent Comments
- Bob G on Gaslighting 1924
- Bob G on Gaslighting 1924
- Bob G on Gaslighting 1924
- conrad ziefle on Gaslighting 1924
- Bob G on Gaslighting 1924
- Bob G on Gaslighting 1924
- arn on Gaslighting 1924
- conrad ziefle on Gaslighting 1924
- Gordon Vigurs on Gaslighting 1924
- conrad ziefle on Gaslighting 1924


Nice smooth transitions! It appears they were intoxicated when they wrote that code!
It’s mind boggling to me that they can simply adjust/alter historical temperature data sets. This is plain and simple fraud.
I am so glad someone has used the F word – FRAUD… there seems to be a recluctance to use the F word on other sites… I have no idea why because there is simply no lack of evidence that they are Hiding The Decline
[youtube=http://www.youtube.com/watch?v=tIQ70is-RPM&fs=1&hl=en_US]
Do they comment on why they are doing this adjusting?
They offer some generalities but I am not aware that they ever produce specific explanations for each adjustment made year by year at individual stations.
It is merely using the proper Al Gore Rhythm for adjusting questionable records to fit a modeled pattern
Matt Ridley’s blog also has an estimated composite value for all current USHCN urban adjustments, which actually exaggerate (not reduce) UHI effect overall by approx 0.5C. See the 3rd and 4th charts in at:
http://www.rationaloptimist.com/blog/best-shot