“My position is the mainstream one, backed up by decades of research,” Dessler wrote on the blog. “This mainstream theory is quite successful at simulating almost all of the aspects of ENSO.
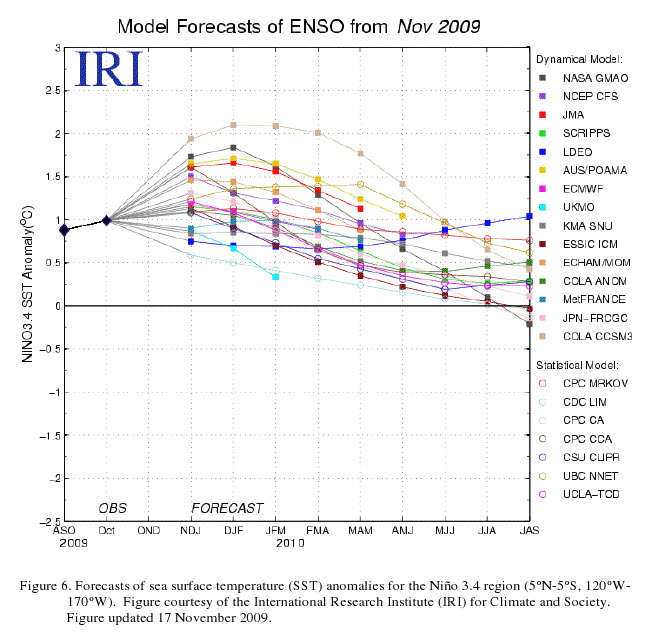
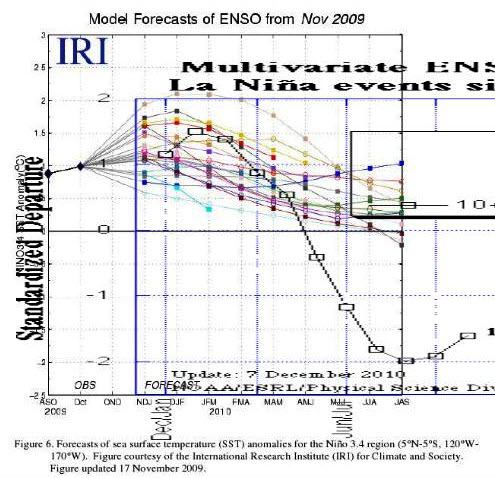
Complete nonsense. Last year at this time, none of the models forecast a La Niña in 2010. Instead, we are having the strongest La Niña on record. They can’t forecast ENSO for six months, much less for 100 years.
The graph below overlays actual in black vs. forecasts.


This is probably the first one to make that claim. Although I seem to recall a discussion at Surreal climate where this was discussed a few years back.
I do not understand why so much money is wasted on so many models that do not produce anything useful.
They should decide which is best able to reproduce reality and work on making that one better.
The climate models are broken because they have been adulterated as a direct consequence of the prostitution of scientific principles to accommodate a commercial and political agenda. If their funding dried up, would they still persist with this dribble? One would think not.
although, not to be picky, he did say “simulating” ENSO, whereas you say “predicitng” ENSO. I did not know climate scientists claimed they could predict when La Niña/El Niño would happen.
Again more proof of fraud or complete incompetence.
If you can’t predict ENSO, you obviously can’t predict the climate.
There’s a list of things climate models are poor at.
tony, anyone can curve fit a known and measured phenomenon. as a 12 year old i used to do it in basic on a vic20. that’s all they are doing.
until their curve fitting produces predictions, their models are nothing more than the toys of 12yo. just way more expensive.
peter,
Sorry
I said in another post that you guys were saying any high school student could see the truth. I stand corrected -Just insert “middle school” in it’s place.
well as far as the truth goes, it is a matter of what they are actually accomplishing as opposed to what they claim they are accomplishing
their research program may be valid, and produce actuall results someday.
in the meantime, like all the other whores, they conduct science by press release, feeding the CAGW alarmist machine.
and that, is dishonest.
Please Peter. this has been civil so far,
but if you start using “grant whores” without attributing to me, I will have to resort to ad hominems.
i did give you proper attribution in another post…don’t sue!
I don’t know that this is the strongest la nina on record, but is is the strongest since 1975 ( http://www.esrl.noaa.gov/psd/people/klaus.wolter/MEI/ ). With this enormous la nina, what do you make of the still high temps measured by UAH and RSS (greater than +0.3)? What if they bottom out at an anomaly greater than zero, say +.05? Such a la nina should send them deep into negative territory – shouldn’t it? And if the next el nino shoots temps up to +.8? What then? We’ll know soon, won’t we.
Owen,
All the other dissenters have left this blog, and I have been doing quite well in attracting all the attacks without needing any help.
Sorry for horning in on your territory.
No problem. You didn’t know.
And I must say I appreciate your apology. Don’t see a lot of that here. Made me a little teary eyed if you must know.
You must be one of those gay black socialist muslims. Pleasure to meet you!
Tropical sea surface temperature between 20 north and 20° south latitudes follows sea level pressure at 80-90°south.
Sea level pressure at 80-90 south bottomed out with a negative anomaly of 16.48 mb lower than the 1948 Mean for July in that month. Looking back to the La Nina of 1999 the lowest anomaly was about 10.5 mb also in mid year. It took a year before sea surface temperature fell to its lowest level with a negative anomaly (in terms of the 1948 mean) of 0.46°C. All that time sea surface temperature anomalies were in the negative because pressure stayed low.
The El Nino of early 2010 produced a maximum positive anomaly of 0.6°C
The anomaly fell to 0.135°C in the month of September and increased to 0.27°C in November. Such is the interest in this stuff that temperature variations of this order are apparently a big deal.
Looking now at sea level pressure in 2010. The sea level pressure anomaly at 80-90° south rose strongly between June and October to about -5.0mb, and fell slightly in November. So, sea surface temperatures at 20 north -20° south stopped falling and actually increased as I noted above.
But pressure at the south pole fell again in November (in anomaly terms) and the SOI has moved up again so this thing has a while to play out yet. The speed of descent was unprecedented and that is reflected in the pressure dynamics at 80-90 south. One swallow never makes a summer but I suspect that that extreme negative anomaly will not be an isolated and unrepresentative figure when we look back in a years time.
And WHY bring up La Niña lowering temps?
That is NOT playing fair. It is COLD in US and Europe, that disproves ACC, and la Niña is just proof that natural cycles always trump ACC.
Actually TonyD:
La Nina and El Nino are just short term ocean, atmosphere weather patterns in a certain location in the Pacific ocean along the equator. They are not climate or proof of climate. A trend of primary El Nino is evidence of warming and primary La Nina is evidence of a cooling trend in the PDO.
Long term Natural ocean atmospheric weather patterns trump ACC!
Now that makes sense! and it is something that can be tested!
So pacific decadal oscillation* just indicates natural cycles and has no connection to mean global energy imbalances?
*that is just so much more romantic sounding than PDO
Lol!!! “This mainstream theory is quite successful at simulating almost all of the aspects of ENSO” ….however the same mainstream theory can’t reliably
predictsimulate the actual dynamics (La Nina/El Nino cycle) of Enso….That’s climate science for you…