Disrupting the Borg is expensive and time consuming!
Google Search
-
Recent Posts
- Analyzing The Western Water Crisis
- Gaslighting 1924
- “Why Do You Resist?”
- Climate Attribution Model
- Fact Checking NASA
- Fact Checking Grok
- Fact Checking The New York Times
- New Visitech Features
- Ice-Free Arctic By 2014
- Debt-Free US Treasury Forecast
- Analyzing Big City Crime (Part 2)
- Analyzing Big City Crime
- UK Migration Caused By Global Warming
- Climate Attribution In Greece
- “Brown: ’50 days to save world'”
- The Catastrophic Influence of Bovine Methane Emissions on Extraterrestrial Climate Patterns
- Posting On X
- Seventeen Years Of Fun
- The Importance Of Good Tools
- Temperature Shifts At Blue Hill, MA
- CO2²
- Time Of Observation Bias
- Climate Scamming For Profit
- Climate Scamming For Profit
- Back To The Future
Recent Comments
- conrad ziefle on Analyzing The Western Water Crisis
- Bob G on Analyzing The Western Water Crisis
- Bob G on Analyzing The Western Water Crisis
- Bob G on Analyzing The Western Water Crisis
- arn on Analyzing The Western Water Crisis
- Scott Allen on Analyzing The Western Water Crisis
- conrad ziefle on Analyzing The Western Water Crisis
- conrad ziefle on Analyzing The Western Water Crisis
- Bob G on Analyzing The Western Water Crisis
- Bob G on Analyzing The Western Water Crisis
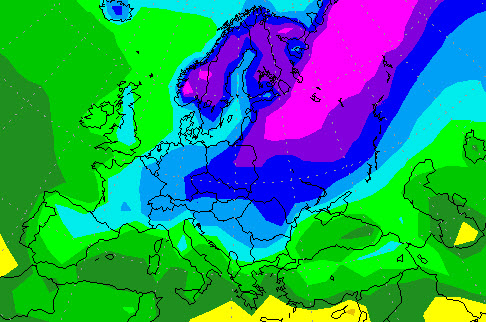
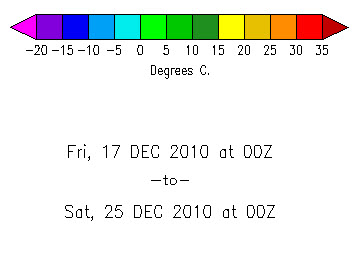
Hottest Year Ever : More Brutal Cold Headed For Europe
This entry was posted in Uncategorized. Bookmark the permalink.


lol, hottest year evuh! Well, the thermometer readings for Nov are still out, but the sat readings are in for both RSS and UAH. RSS comparison for 1998 vs 2010. If the formatting holds, The number protruding to the right is the anomaly it has to be for 2010 to equal 1998 avg. monthly temp anomaly.
1998 0.55 0.64
1998.08 0.736 0.588
1998.17 0.586 0.652
1998.25 0.858 0.546
1998.33 0.668 0.588
1998.42 0.568 0.535
1998.5 0.606 0.608
1998.58 0.573 0.583
1998.67 0.494 0.525
1998.75 0.461 0.293
1998.83 0.196 0.312
1998.92 0.312 0.738
0.550667 0.53363
1998 UAH 2010 UAH
1998 0.582 0.648
1998.08 0.753 0.603
1998.17 0.528 0.653
1998.25 0.77 0.501
1998.33 0.645 0.534
1998.42 0.562 0.436
1998.5 0.51 0.489
1998.58 0.518 0.511
1998.67 0.458 0.603
1998.75 0.416 0.426
1998.83 0.192 0.381
1998.92 0.277 0.426
0.51758 0.5259
UAH seems to have the only reasonable shot, but even that’s unlikely unless we get a sudden shift in the trends. I thought an increase in atmospheric CO2 was suppose to raise temps?
http://vortex.nsstc.uah.edu/public/msu/t2lt/
http://www.ssmi.com/msu/msu_data_description.html
Flipping heck, suyts.
Give GISS and HADCRUT enough time to adjust the data.
lol, yeh it only been over a week to average 30 whole days of temps. Those guys are pretty good until it comes to tricky maths such as division.
lol, ok, the formatting didn’t hold. I should have used a space holder. RSS dec temp anomaly necessary to equal 1998 0.738 <—(ain't gonna happen), UAH dec temp anomaly necessary 0.426 <—–(could happen but not probable.)
I just saw that places in Florida have averaged 12 degrees below normal for this December, with even colder weather coming next week. If we keep cooling at this rate, the Florda tourist (and citrus) industry is doomed!!!
Keep in mind when there are large upward steps in LT temps it does not equate to warming; it is a release of heat from the oceans which means the earth is cooling translating to surface temps dropping rapidly. Look at what happened at the end of October, then again the end of November. http://discover.itsc.uah.edu/amsutemps/execute.csh?amsutemps
See also AO
http://www.cpc.noaa.gov/products/precip/CWlink/daily_ao_index/ao_index.html
This ENSO cycle included a Modoki El Nino which envelops a larger area than a normal El Nino event. That could very well be part of the explanation for the plummeting surface temps once the LT began clearing out the heat. Also, IIRC, Modoki El Nino’s don’t typically result in La Nina.
We have yet to experience the largest effects of this La Nina which has not yet hit bottom and in fact according to the most recent forecasts will drop significantly more in the coming month.
I think there will be a warm period coming at the end of the month, then later in January we will really see La Nina rearing its ugly head.
my 2c
Headed for here too!
Difficult to forecast European weather, let alone temperatures.
One moment purple is dominating the picture, the next moment it’s gone
However, the blue sticks
http://wxmaps.org/pix/temp4.html