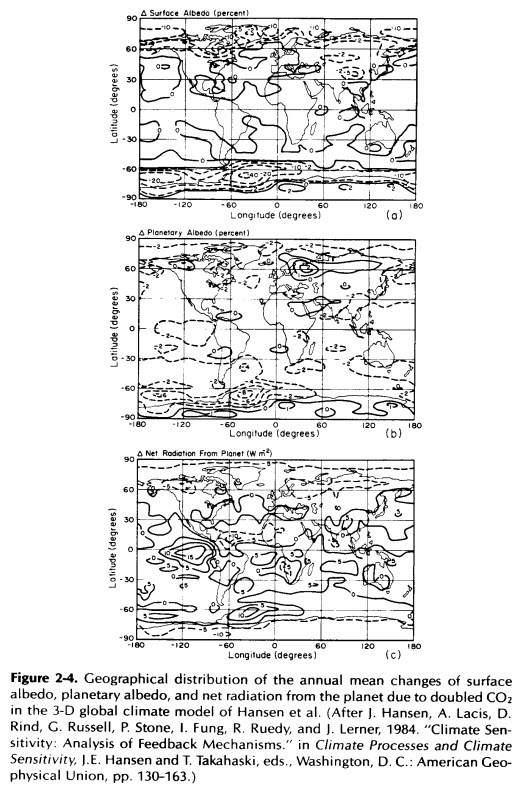
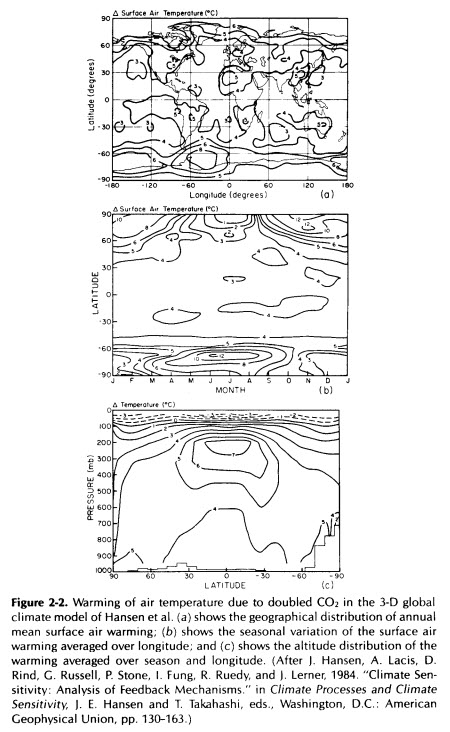
In 1984, Hansen forecast symmetrical sea ice loss and warming at both poles.
http://www.epa.gov/climatechange/effects/downloads/Challenge_chapter2.pdf
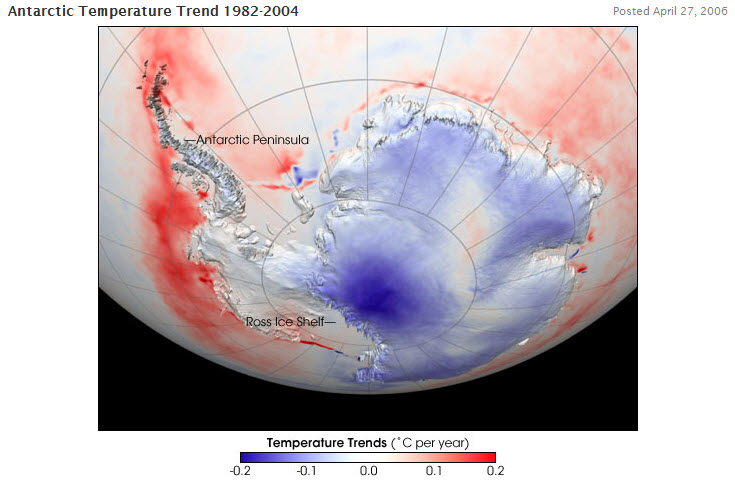
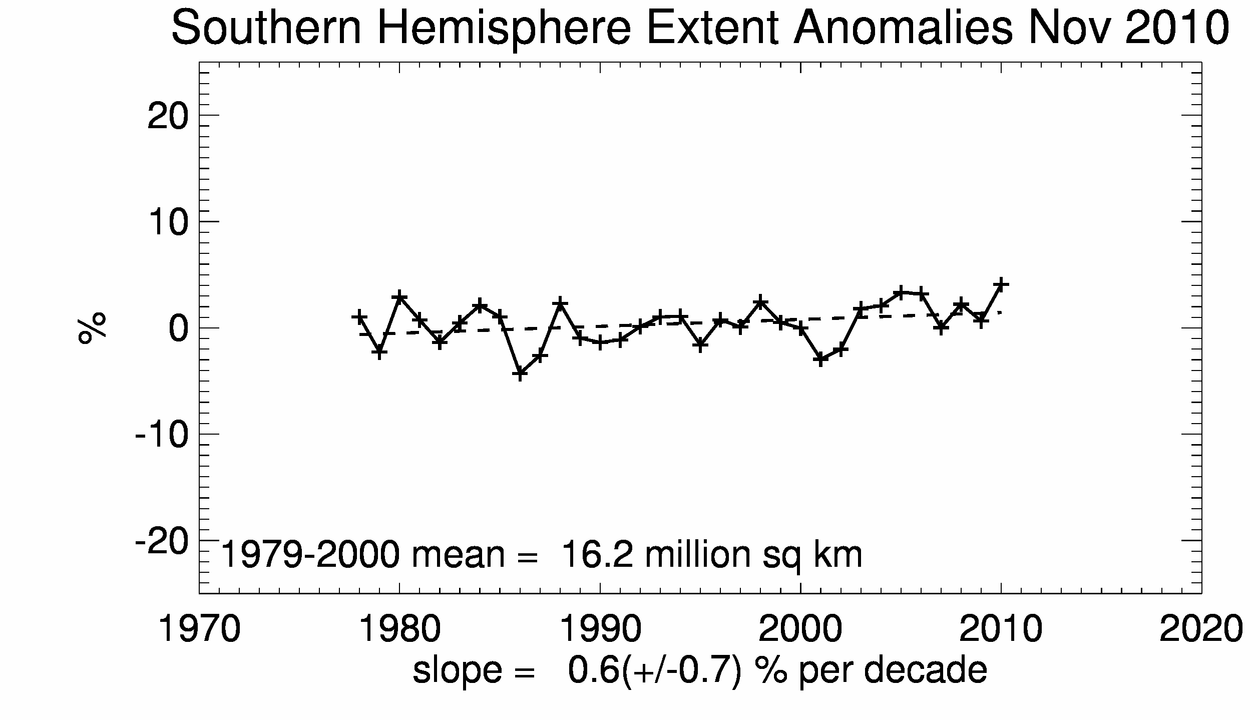
That didn’t work out so well. Instead of warming and losing ice, Antarctica cooled an gained sea ice – as this 2006 NASA image shows.
http://earthobservatory.nasa.gov/IOTD/view.php?id=6502
http://nsidc.org/data/seaice_index/images/s_plot_hires.png
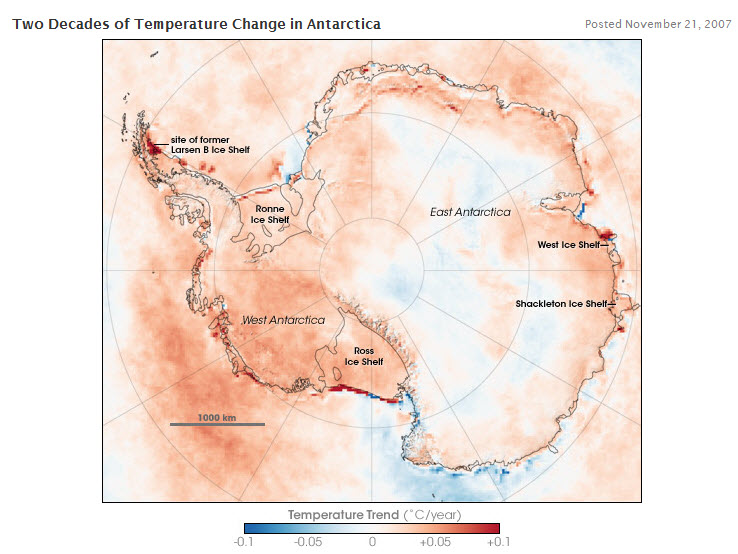
But then something very typical of GISS happened in 2007. The data suddenly changed. Antarctica’s long term temperature trend changed from strong cooling, to warming.
http://earthobservatory.nasa.gov/IOTD/view.php?id=8239
NASA justified this trend reversal with the following statement : The scientists estimate the level of uncertainty in the measurements is between 2-3 degrees Celsius.
So they switched a long term cooling trend into a warming trend, based on measurements with an error bar more than an order of magnitude greater than the trend. In other words, Hansen’s Ministry Of Information didn’t want a map out there showing Antarctica getting cooler.


“Hansen’s Ministry Of Information”
Typo – should be: Misinformation
Wow, yet another scandal unearthed by Steve.
This is what NASA writes about the old image: “This image was first published on April 27, 2006, and it was based on data from 1981-2004. A more recent version was published on November 21, 2007. The new version extended the data range through 2007, and was based on a revised analysis that included better inter-calibration among all the satellite records that are part of the time series.”
Furthermore, a slope of 0.6 (+/-0.7)% per decade (of what? I assume ice cover? You don’t mention it) isn’t proof of a strong cooling trend.
So if Hansen tricked the lot, why didn’t he do that in 2006, too?
Couldn’t it be that the measurements have simply improved, and that there is more data to analyse? Or, God forbid, that Antarctica is warming, too?
lol, yeh, well, not so much. O’Donnell et al 2010 pretty much shows almost no warming at all. Weird, but it turns out GISS has been extrapolating and interpolating from the peninsula. Not that it matters, going from an average of -100 degrees to -90 wouldn’t make one little bit difference to anything.
If you’re trying to assert GISS doesn’t fudge the numbers then you’ve either haven’t been paying attention or are willfully ignoring events such as demoting 1998 in favor of 2005 or demoting 1930’s so 1998 cold be the hottest evuh. Yeh, each time, its because a “better understanding” happened.
Yeah, I see little reason to doubt NASA. Especially since, as I pointed out, if they are in some conspiracy to deceive us all, why didn’t they do it consistently – that is, in 2006, too?
Revisions in the light of new data and techniques happen, sometimes up, sometimes down. You can shout “Conspiracy!” every time something changes that seems to confirm your suspicions, but then who’s alarmist here?
Out of interest, where can I find that O’Donnell et al 2010 study you quote? I suppose that shows antarctica is not warming? Or does it simply fail to show any significant change? You make me curious.
lol, yeh, 1998 they found new data from the 30’s to adjust the hottest evuh down so 1998 was the hottest. Later, in 2005, they found new data from 1998 and revised it downward. Now?……
Yes, sometimes they go down and sometimes the revisions are up. I’ve literally seen over 1000 examples. Always, the downward revision is distant past and the recent revisions are near present. Its the never ending upward slope. I’ve never seen it the other way around. Do you want examples, or are you going to blindly put your faith in the adjusters?
GISTemp changes in recent years
Part 1
http://www.youtube.com/watch?v=6ROMzxA4A9c
GISTemp changes in recent years
Part 2
http://www.youtube.com/watch?v=w8ZhWZj8zfQ
So you think the Emperor is wearing clothes.
(Darn, I need to practice more with those HTML tags & attributes.)
and was based on a revised analysis that included better inter-calibration among all the satellite records that are part of the time series.
in other words, we are manipulating the evidence to support our hypothesis
That’s the paranoid interpretation, yes. Or it could just mean what it says.
keep on hammering on the propaganda anvil Propaganda Pumper
Senses Seeker, seek some sense and you will see it don’t make sense.
Yes, it is one Grand Conspiracy of deception, fraud, exaggeration, lies – all played out on numerous levels, in almost every scientific body on this earth. It might be hard to swallow, but the sad facts are true.
So it’s 0.1C but the error is 2-3C?
So 0.1C+/-2C to 3C
Scarlet:
That is about it for the entire global land temperature set but sea surface temperatures are so corrupted you can not even apply a 3C error and and claim it represents reality.
In the last 150 years the globe has warmed .8C + /- 3C or not statistically significant warming or cooling as it could have been either.
Then we have no guarantee that the temperature measurements they are getting today are any more accurate. In a year or two, they could have a “better understanding” of today’s measurements.
The scientists estimate the level of uncertainty in the measurements is between 2-3 degrees Celsius.
When your integrity is this awful you can make anything happen.
The scientists estimate the level of uncertainty in the measurements is between 2-3 degrees Celsius.
In a war over 1/100ths of a degree you might as well make up a world that allows this much error so you can claim victory, just like Baghdad Bob
http://www.youtube.com/watch?v=TrXhxmQJSS0