The Met Office insists that Greenland is hot.
Disrupting the Borg is expensive and time consuming!
Google Search
-
Recent Posts
- Gaslighting 1924
- “Why Do You Resist?”
- Climate Attribution Model
- Fact Checking NASA
- Fact Checking Grok
- Fact Checking The New York Times
- New Visitech Features
- Ice-Free Arctic By 2014
- Debt-Free US Treasury Forecast
- Analyzing Big City Crime (Part 2)
- Analyzing Big City Crime
- UK Migration Caused By Global Warming
- Climate Attribution In Greece
- “Brown: ’50 days to save world'”
- The Catastrophic Influence of Bovine Methane Emissions on Extraterrestrial Climate Patterns
- Posting On X
- Seventeen Years Of Fun
- The Importance Of Good Tools
- Temperature Shifts At Blue Hill, MA
- CO2²
- Time Of Observation Bias
- Climate Scamming For Profit
- Climate Scamming For Profit
- Back To The Future
- “records going back to 1961”
Recent Comments
- Bob G on Gaslighting 1924
- Bob G on Gaslighting 1924
- conrad ziefle on Gaslighting 1924
- Bob G on Gaslighting 1924
- Bob G on Gaslighting 1924
- arn on Gaslighting 1924
- conrad ziefle on Gaslighting 1924
- Gordon Vigurs on Gaslighting 1924
- conrad ziefle on Gaslighting 1924
- Robertvd on Gaslighting 1924


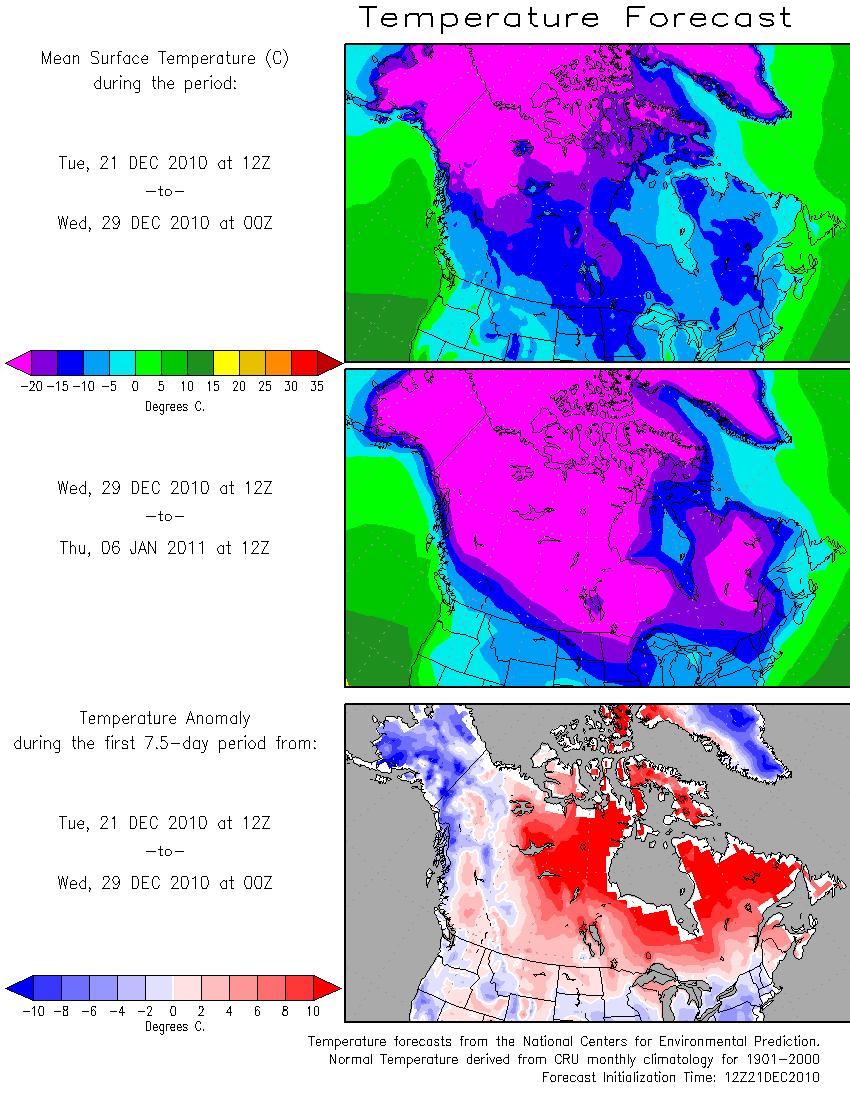
Looks like a little below normal for southern Alberta for the 2nd week, and near normal for this week. However, here close to Calgary we are about to get a nice push of chinook air (otherwise known as CAGW) for the Christmas time frame. Currently, we are running about -1C below normal for the month of December. HOWEVER, I figure Jimbo could ‘adjust’ that to red…
Greenland though, is egg cooking temps…
That’s totally weird..
In the anomaly map, Canada is showing 10 above normal, and in the absolute map, around -20C, so that would mean normally it is around -30, yet parts of Greenland are showing 10 below normal, and absolute is around -20. That means Greenland is “normally” -10, or some 10 degrees warmer than Canada.
Something doesn’t quite gel
The anomaly map is for the first week. The cold air doesn’t arrive in Eastern Canada until the second week.
The Met Office insisted that Greenland was hot, not that it will be hot in 2 weeks time.
As this graph shows, on Sunday Greenland had positive anomalies throughout
http://www.esrl.noaa.gov/psd/map/ANIM/sfctmpmer_01a.fnl.28.gif
And all this is rather missing the point that even in the images above there is a large red warmer-than-average (+10C) patch covering a large part of Canada. That warm spot has probably moved over the last few weeks so I wouldn’t be surprised if say a week ago it was over Greenland. But does it really matter where it is rather than the fact it exists?
Either way the cold in the UK and northern europe is matched by warmer than average temperatures elsewhere. So the idea that the world must be currently cold because the UK is cold does not logically follow. There’s even a North/South divide in Europe:
http://wxmaps.org/pix/temp4.html
Surely to show that the world is colder than average couldn’t you just average all the anomalies in the various regions? If you accept extrapolated weather station data (what else are these maps based on?) then why can’t you take that data and tot up the values to see whether the average anomaly on the earth is currently warmer or colder than average? I think this has already been done in fact…
Yes, the Met Office said it was hot everywhere besides western europe.