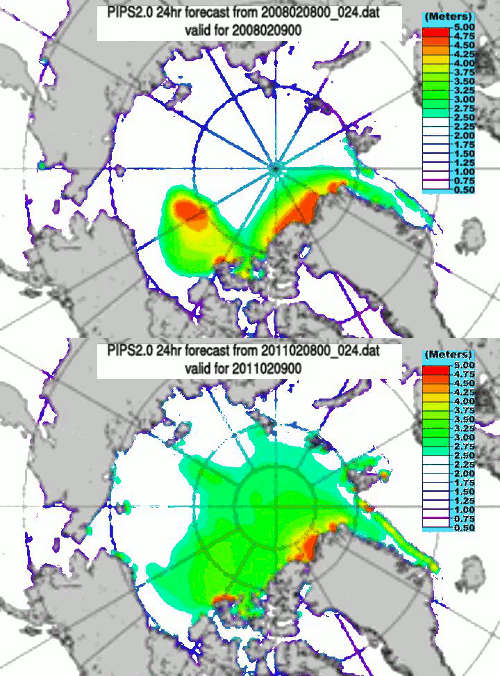
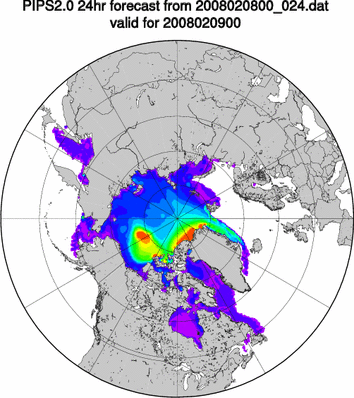
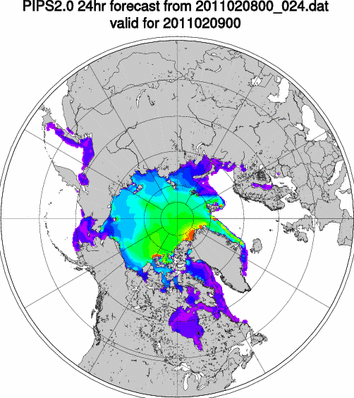
According to US Navy PIPS2 maps, the area of thick Arctic ice has more than doubled, and the volume of Arctic ice has increased by 26% – since 2008. You can see from the graph below that ice thickness distribution has shifted dramatically to the right since the same date in 2008.
You can also see why NSIDC only likes to talk about 4+ year old ice. The reason being that it will take another two years to recover from the 2007 low.
The blink comparator below shows growth of ice greater than 2.5 metres thick.


The alarmists on a daily basis scream about melting Artic sea ice. There was an article just yeserday at the Washington Post weather web site that did so.
Steve, it’s amazing that the navy doesn’t go to their bosses and tell these IDIOTS TO STF UP, thank god they don’t go by those ice free reports!!!
How does this information change the fact that Arctic sea ice loss causes back to back to back blizzards in the Rocky Mountains down to Juarez, Mexico?
Great sarcasm! Very funny.
I wish I found it funny. Lately I have been getting so sick about these people and their abject stupidity I can’t even make jokes any more
Beer helps!
suyts says:
February 8, 2011 at 3:36 pm
Beer helps!
…………………………………………………………
So now you need beer goggles to read about global warming?
lol, the ice loss caused the increase of volume.
good one Suyts!! agree Brian, getting harder to make jokes anymore!?
only when you turn the volume to 11
or so goes the logic…
And according to the Colbert Report the number of elephants has increased sixfold in the same time.
I wanted to send my Dr. Seuss aerosol boat into the Arctic (click my gravatar) to spray aerosols so more snow would be created to fall and create more ice. [This is my new geoengineering idea.] But it got stuck! So much for getting $rich$ from a new government grant. Any NGOs interested?
Thanks for this great post. Meanwhile, the latest government data for the contiguous US shows a definite cooling trend since the great El Nino if 1998. Current 13 year trend is -17 deg C per century!
http://thetruthpeddler.wordpress.com/2011/02/08/official-government-data-confirms-that-us-is-cooling-at-a-rate-of-over-17-deg-ccentury-since-1998/
Thanks, Truth.
I was thinking: how do I go about staking out land that is currently just out in the surf? I live on an island in the Gulf of Mexico, and houses right near the water are priced in the $millions.
Is there a way to buy up the land rights 10 feet further into the water for when the level plummets? At 17°/century, the water should be about 50-100 feet further out in 20 years or so.
Yeah, maybe Gore’s new beach front mansion won’t stay beach front much longer. LOL.
I hate to break it to you, but increased ice formation in the arctic region is yet another sign of global warming. Al Gore told me so.
Everything is global warming to Al Gore. He’s slipping into being a caricature of himself. Just funny now.
He also said that global warming causes amino acids in meteorites! 😉
Is there any wind effect here? Has there been a prevailing westerly in the past year or so that pushed ice to the east (hence thinner ice to the west and some thicker ice to the east) as opposed to conditions in 2008 when there was more thicker ice spread out to the west? Maybe some change in the water currents, also compacting ice toward the east?
IanM
A three year trend on the back of the lowest point on the record – I’m a believer!
Call me sceptical but any idea what the percentage was in 2007 down from the long term average?
Pingback: Global Warming Hoax Weekly Round-Up, Feb. 10th 2011 « The Daily Bayonet
Regarding Mark Boslough’s Jan. 25 My View, “Climate-change deniers ignore science,” and in subsequent responses, there was discussion of Harrison Schmitt’s statement in 2009 that Arctic sea ice had recovered to 1989 levels. Since data from the National Snow and Ice Data Center were cited, we feel it worthwhile to clarify the issue for readers.
Sea ice conditions can vary from month to month, but overall we see the continuation of a strong downward trend. You can read our 2009 season analysis at http://nsidc.org/news/press/20091005_minimumpr.html.
While 2009 Arctic sea ice extent did briefly exceed 1989 levels in April and May, it was substantially less than 1989 the rest of the year. The 2009 maximum extent, minimum extent, and annual average extent values were all well below 1989. Based on these facts, it would be incorrect to suggest that 2009 represented a recovery of Arctic sea ice to 1989 levels.
NSIDC posts the most recent data and regularly updated analyses of conditions at _http://nsidc.org/arcticseaicenews/._
Walt Meier and Mark Serreze are senior research scientists at National Snow and Ice Data Center, University of Colorado at Boulder.
Thanks for injecting a little common sense. I’m not convinced about the PIPS 2 ice thickness data accuracy, PIPS3 remains closely guarded by the navy. If even if PIPS 2 is anywhere near correct it shows a remarkable decline in 2.5 to 5 year plus ice, to almost nothing. I also wonder about choosing 2.5m ice thicknes and the date/years. 2008 and 2009 where recovery years from the dramatic loss in 2007. This recovery stalled in 2010, retreating back to 2008.
Pingback: Anonymous
Pingback: Anonymous
Good stuff.
Correction, for “..year plus ice,” read ‘metre plus ice’ (thickness)
Yes you can make your comparisons by looking at year over year comparisons (and include a high year) and come to your misleading conclusion, or you can look at more robust (long term) datasets and compare to those averages… If you do the latter, its pretty hard to come to the conclusion that the ice is growing…
http://nsidc.org/arcticseaicenews/files/2012/02/Figure2.png