How many angels can dance on the head of a pin? Last year was the hottest year ever – by 0.01C.
Disrupting the Borg is expensive and time consuming!
Google Search
-
Recent Posts
- Gaslighting 1924
- “Why Do You Resist?”
- Climate Attribution Model
- Fact Checking NASA
- Fact Checking Grok
- Fact Checking The New York Times
- New Visitech Features
- Ice-Free Arctic By 2014
- Debt-Free US Treasury Forecast
- Analyzing Big City Crime (Part 2)
- Analyzing Big City Crime
- UK Migration Caused By Global Warming
- Climate Attribution In Greece
- “Brown: ’50 days to save world'”
- The Catastrophic Influence of Bovine Methane Emissions on Extraterrestrial Climate Patterns
- Posting On X
- Seventeen Years Of Fun
- The Importance Of Good Tools
- Temperature Shifts At Blue Hill, MA
- CO2²
- Time Of Observation Bias
- Climate Scamming For Profit
- Climate Scamming For Profit
- Back To The Future
- “records going back to 1961”
Recent Comments
- Bob G on Gaslighting 1924
- Bob G on Gaslighting 1924
- conrad ziefle on Gaslighting 1924
- Bob G on Gaslighting 1924
- Bob G on Gaslighting 1924
- arn on Gaslighting 1924
- conrad ziefle on Gaslighting 1924
- Gordon Vigurs on Gaslighting 1924
- conrad ziefle on Gaslighting 1924
- Robertvd on Gaslighting 1924


again….
Since they can’t hype warming, they are trying to hype “tied”….
Tied means there has been no warming for the past 6 years.
Yep, tied, as in not greater than, and only on one data set.
In February 2011 the Illinois State Climatologists website showed state average temperature at 29.5F degrees .7F BELOW average. NCDC’s website states that for Illinois, “The average temperature in February 2011 was 30.3 F. This was 0.7 F warmer than the 1901-2000 (20th century) average,…”.
Is Hansen adjusting NCDC data?
NCDC “homogenizes” data before they give it to Hansen.
Well there’s that, but more importantly …
What portion of that fraction of a degree is man-made and unavoidable?
For logic impaired green liberals, I am asking a simple question: what would be the temperature delta from 1890-2010 if homo sapiens had gone extinct 20 KYA and the planet were left to its own devices?
We wouldn’t be here to know. The rest of the planets critters don’t care, they just get on with it. (they’re smarter than us)
(that was a trick question right?)
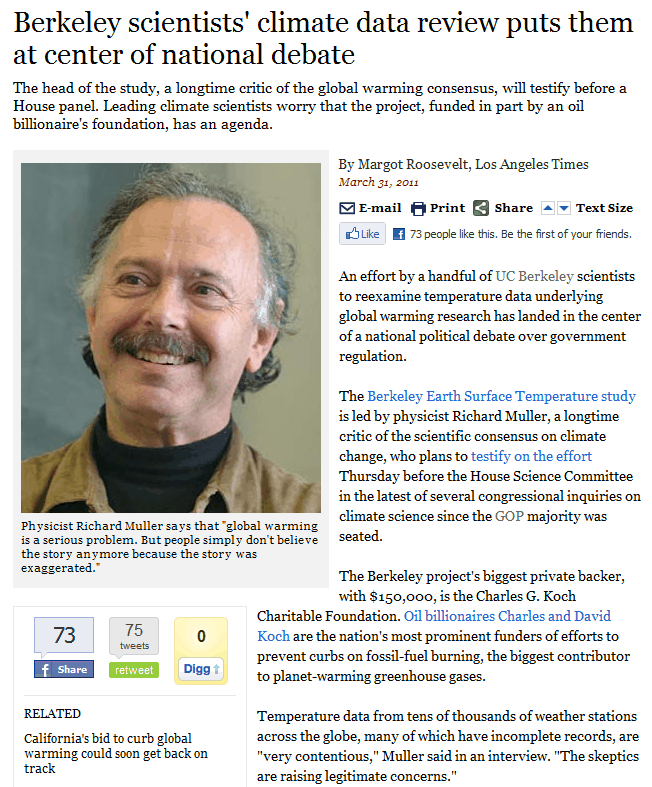
Berkeley and Koch. They found a team no one will believe even if their figures are correct.
Willis has a good post one their proposed methodology @ WUWT……… sigh.
Crap……… giant NVM on this bs.
http://wattsupwiththat.com/2011/03/31/clarification-on-best-submitted-to-the-house/#more-36957
Trenberth worries there will be an agenda? Like truth?
And how does Thorne pretend to be a scientist? Claims “all the signs are there”, then lists things which aren’t happening?
Any idiot knows you don’t set up a weather station surrounded by asphalt and concrete. I knew that when I got my first thermometer, at age 8.
At some Universities they place their thermometers on the roof because there is not enough ground area to meet the requirements. Just place it in a shelter on top of a 4 story building with a white roof!