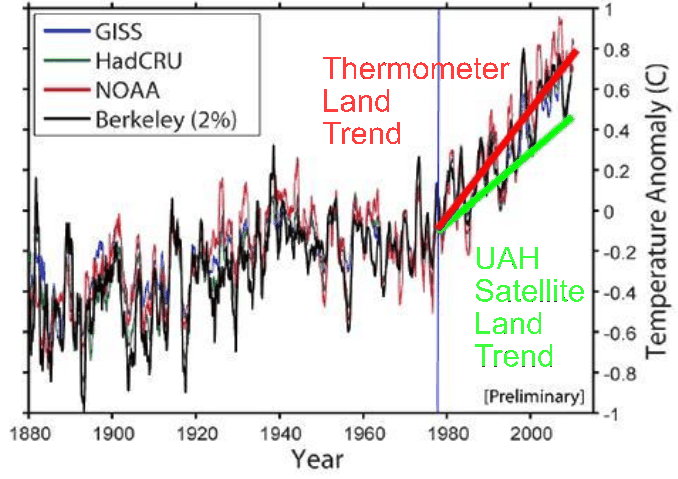
Yesterday I pointed out that Muller’s graph did not match HadCRUT global temperatures. This was due to the fact that Muller was using only land based thermometer readings and did not include ocean temperatures – which comprise 70% of the Earth’s surface – have risen more slowly.
So let’s assume that Muller has proven that land temperatures are consistent between HadCRU, GISS and Berkeley. They all show a rise of about 0.3C per decade since the start of the satellite record in 1978. Satellite data from UAH shows a much smaller rise over land of 0.18C per decade during that same time period.
Satellite data is measured at 14,000 feet, and would exaggerate the warming if it was due to “global warming.” However, we see the exact opposite. The only plausible explanation is that the surface record is biased by UHI effects, because thermometers are located where humans live, build roads, remove snow, heat their homes, build buildings, etc.
I have a thermometer on my bicycle, and frequently see a 2-5C temperature difference between a large road and an open-space bicycle trail two blocks away. I have also seen a 5-10C difference between Tempe, Az. and the open desert 20 miles to the south.
I’m sending this to Dr. Muller for comment.


I made a similar comment 2 days ago over at NYT Dot Earth under Andy Revkin’s post “Republicans Get Inconvenient Replies at Climate Hearing”. This is part of what I wrote-
“McKitrick et al.’s identification of UHI in the surface temperature trend indicates an overestimate of up to a factor of 2.
Assuming the climate models reflect reality, the lower troposphere temperature trends from satellite and balloons show that surface temperature trends are overestimated by a factor of 1.5 – 2.
The ‘official’ surface temperature sets claim to compensate for all UHI, siting, TOBS and instrument biases.
That Muller’s first glimpse, with no bias adjustments, agrees so well with the ‘official’ surface temperature sets is actually bad news for the consensus surface temperature trends over the past half-century.”
Exactly. It means their “adjustments” and homogenization inadequately account for known artificial upward steps in the temp records. In fact, the homogenization and gridding is lending an upward bias to all land surface stations.
While you’re at it….
Since Satellite data exaggerates the warming, what does he think it really is.
Why can’t Muller or some other scientists get 5 calibrated thermometers and put one of them by a road and the others nearby on grassy areas and compare the temp differences?
They understand the differences, but what they are stating, essentially, is that the sitings doesn’t effect the trend. In other words, they state, a thermometer on asphalt will show the same trend as on planted in a field, only the one in the field will be cooler. Yet show the same trend. This is basically true.
But we know this thinking to be erroneous because this doesn’t account for urban sprawl in a time series. A thermometer that was placed in a field 70 years ago is likely to be near asphalt now. (Or BBQs or air conditioners, or sewage ponds……)
The signal is probably too complicated to discern for these………. mental giants. Dr. Spencer did some interesting work on UHI and showed the signal to be logarithmic in relation to proximity to population density. For instance, the increase in UHI was more significant going from zero population to 5 than going from 100,000 to 500,000.
Temperature readings in front (south) and in back(north) of my house can give entirely different readings and trends. Both thermometers consistently give the same readings only (to a fraction of a degree) when there is a cloud cover and no wind; high humidity also helps. Otherwise, temperature differences of 10 deg.F are very typical, the higher temperature being measured in front of the house in the shade under an open porch. This makes me believe that temperatures are only unaffected by location during times of cloudiness, stillness and high humidity. The only trustworthy temperature readings available (since 1979) are from microwave satellite measurements that take the average over the whole earth and across most of the atmosphere.
“I’m sending this to Dr. Muller for comment.”
Be sure to check your in-box often. I’m sure he’ll be getting right back to you on that.
He complained on Revkin’s blog yesterday that I should have contacted him, so I am assuming that he will get back back to me.
Last summer, while riding thru beautiful downtown Bethesda, MD, my car thermometer read 103. Then riding thru a nice park with a stream, it dropped 10 degrees, to 93. Upon leaving the park and getting on the DC Beltway, the temp shot right back up to 103. So exposure is very important, can make 10 degrees (F) difference. That alone can account for all of scenario “A”.
Steve,
You mean to say that Dr. Muller did not notice these differences between satellite and SAT?
Oh my…..