I just took the CU satellite sea level data and split it into two equal chunks. Then I plotted and ran a trendline through each chunk. The earlier chunk has a noticably steeper trendline than the later chunck. This indicates that the rate of sea level rise is falling. And this would contradict the idea that ice sheet melting is accelerating. If the ice sheets are melting faster and if Trenberth’s missing heat is in the deep oceans, then why isn’t the sea level showing it.

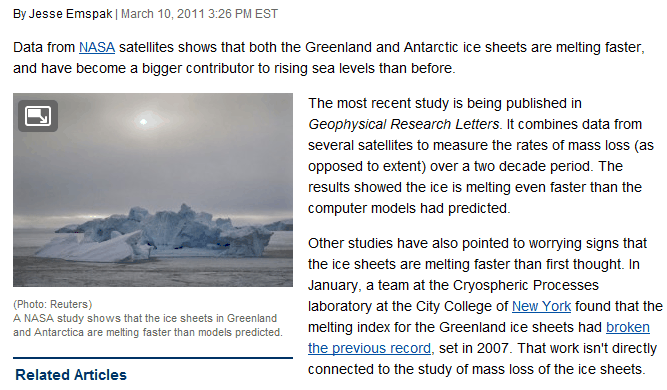
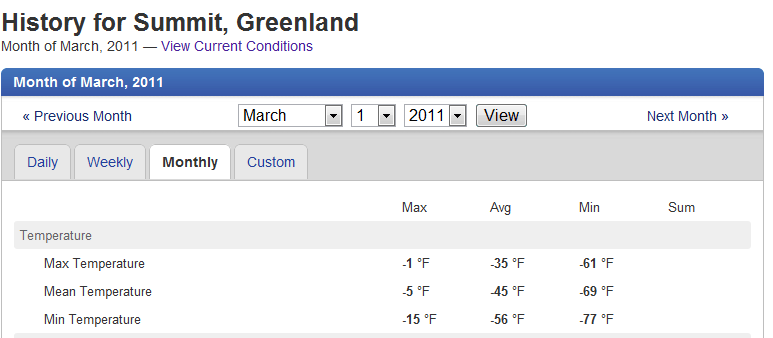


These people are beyond shameless.
I just took the CU satellite sea level data and split it into two equal chunks. Then I plotted and ran a trendline through each chunk. The earlier chunk has a noticably steeper trendline than the later chunck. This indicates that the rate of sea level rise is falling. And this would contradict the idea that ice sheet melting is accelerating. If the ice sheets are melting faster and if Trenberth’s missing heat is in the deep oceans, then why isn’t the sea level showing it.
Yes I have written several articles analyzing that.