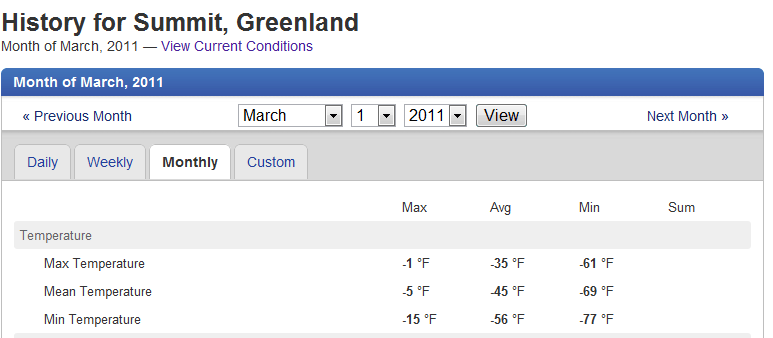
http://www.wunderground.com/history/station/04416/2011/3/1/MonthlyHistory.html
Disrupting the Borg is expensive and time consuming!
Google Search
-
Recent Posts
- “Why Do You Resist?”
- Climate Attribution Model
- Fact Checking NASA
- Fact Checking Grok
- Fact Checking The New York Times
- New Visitech Features
- Ice-Free Arctic By 2014
- Debt-Free US Treasury Forecast
- Analyzing Big City Crime (Part 2)
- Analyzing Big City Crime
- UK Migration Caused By Global Warming
- Climate Attribution In Greece
- “Brown: ’50 days to save world'”
- The Catastrophic Influence of Bovine Methane Emissions on Extraterrestrial Climate Patterns
- Posting On X
- Seventeen Years Of Fun
- The Importance Of Good Tools
- Temperature Shifts At Blue Hill, MA
- CO2²
- Time Of Observation Bias
- Climate Scamming For Profit
- Climate Scamming For Profit
- Back To The Future
- “records going back to 1961”
- Analyzing Rainfall At Asheville
Recent Comments
- Bob G on Climate Attribution Model
- Bob G on Climate Attribution Model
- Bob G on Climate Attribution Model
- Robertvd on “Why Do You Resist?”
- arn on “Why Do You Resist?”
- Gamecock on “Why Do You Resist?”
- Bob G on Climate Attribution Model
- Gordon Vigurs on Climate Attribution Model
- Bob G on Climate Attribution Model
- John Francis on “Why Do You Resist?”


These people are beyond shameless.
I just took the CU satellite sea level data and split it into two equal chunks. Then I plotted and ran a trendline through each chunk. The earlier chunk has a noticably steeper trendline than the later chunck. This indicates that the rate of sea level rise is falling. And this would contradict the idea that ice sheet melting is accelerating. If the ice sheets are melting faster and if Trenberth’s missing heat is in the deep oceans, then why isn’t the sea level showing it.
Yes I have written several articles analyzing that.