http://www.aoml.noaa.gov/hrd/hurdat/ushurrlist18512009.txt
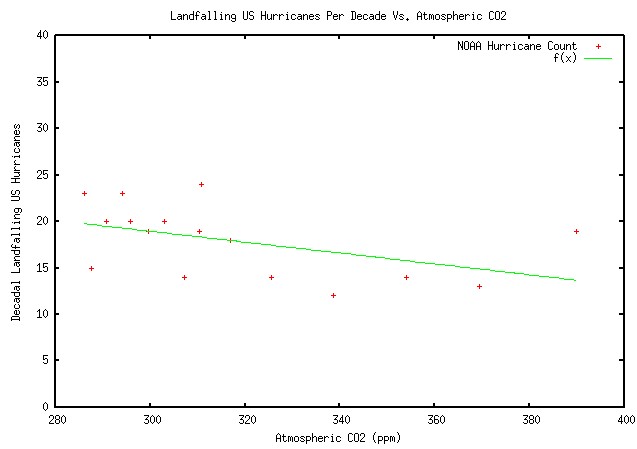
The graph above plots number of hurricanes per decade (since 1851) vs. CO2 levels at the end of the decade. The vast majority of landfalling hurricanes hit with CO2 below the safe level of 350 ppm.


What’s the plot of co2 v non landfalling hurricanes?
Andy