
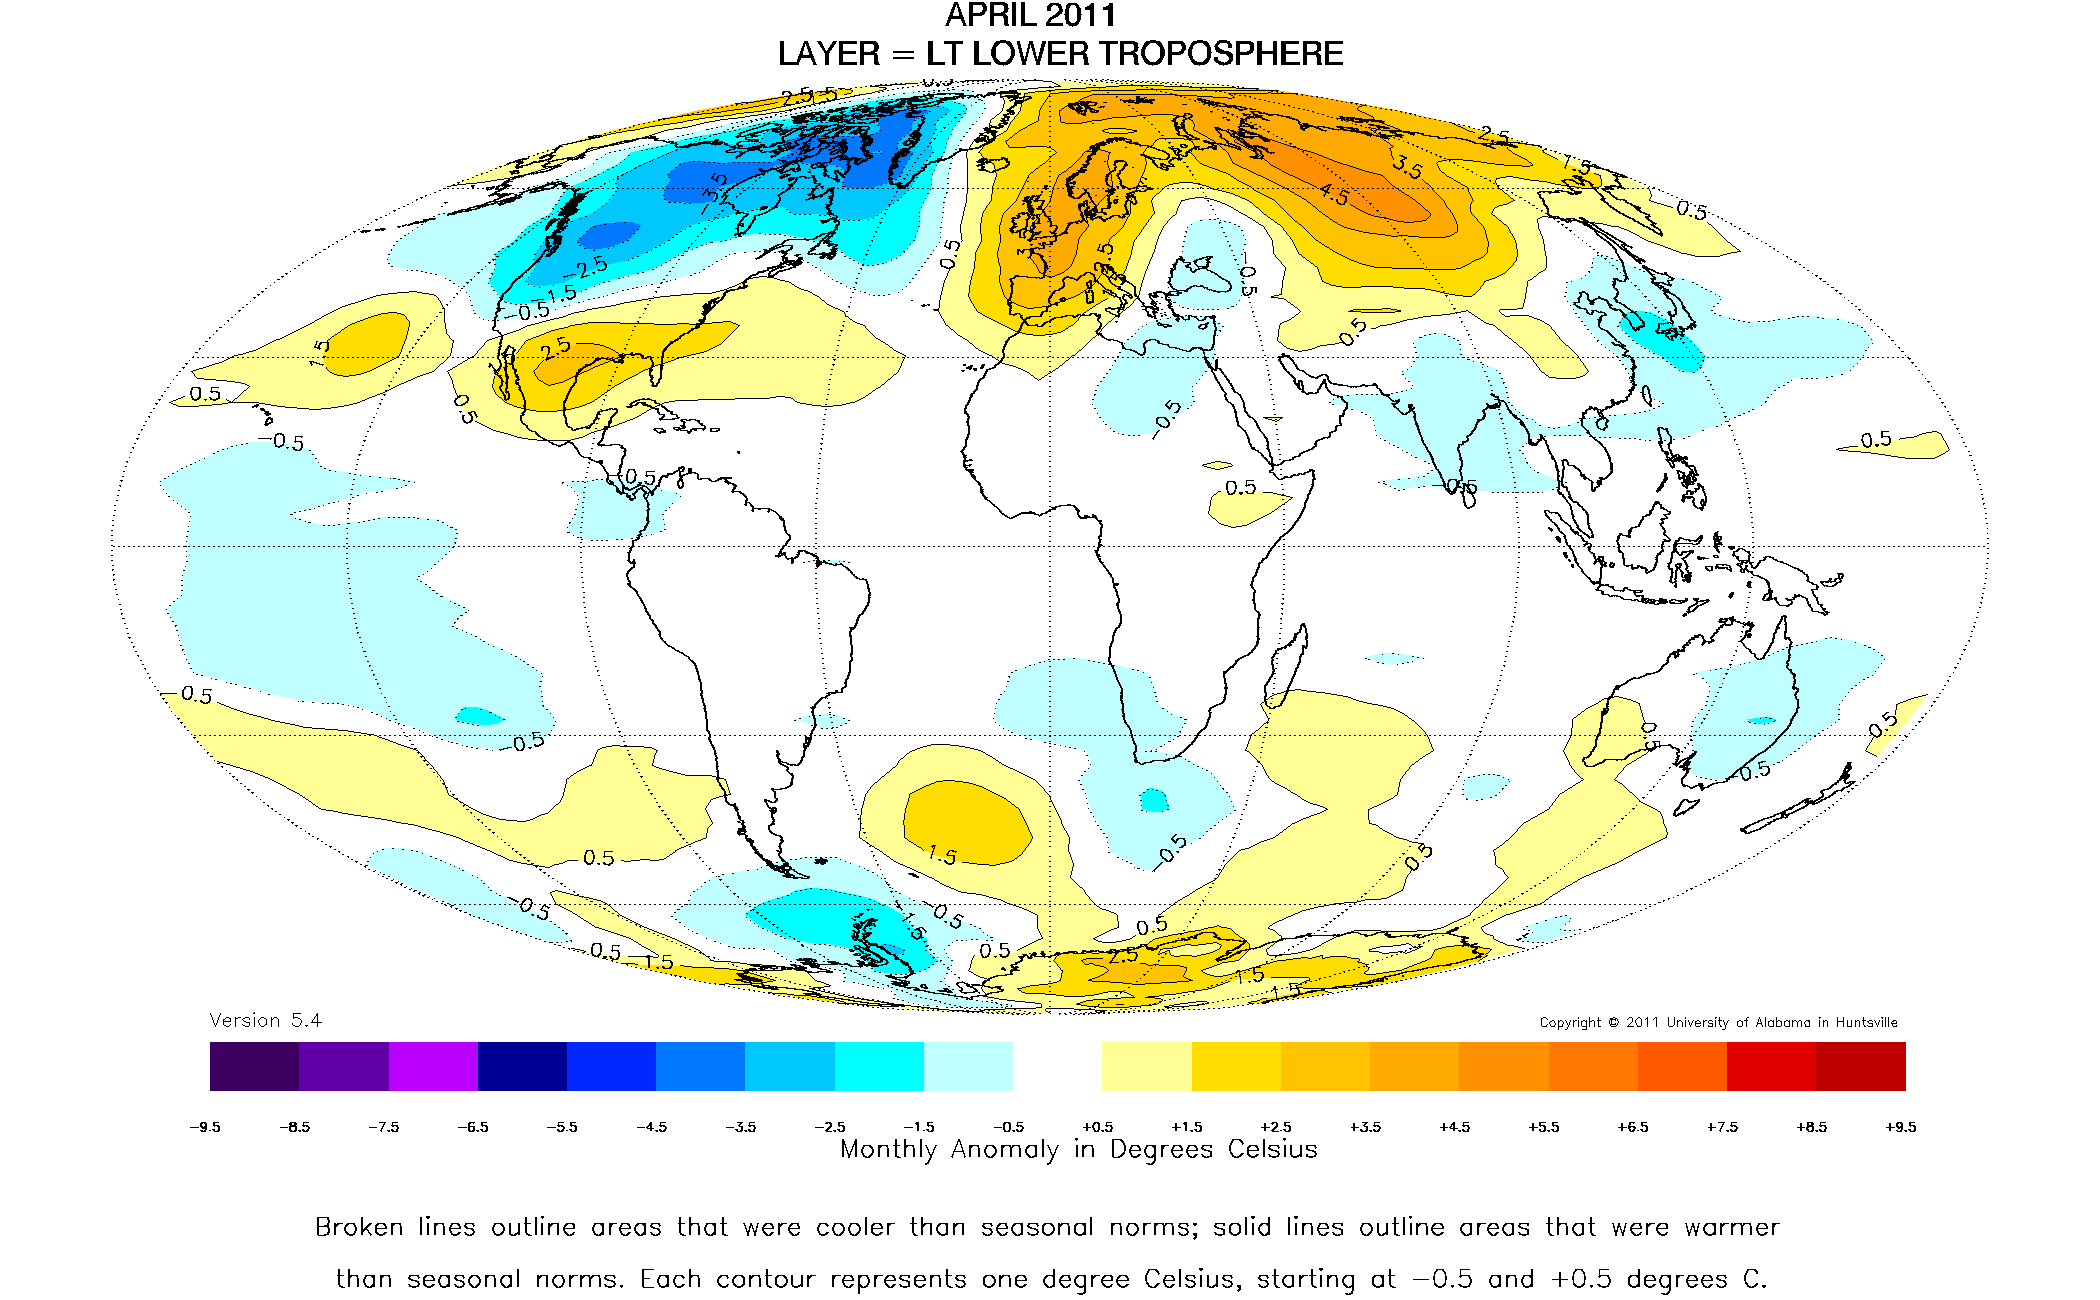
GISS April, 2011 found a very hot spot over Paraguay, which satellites didn’t show. The anomaly map below uses a baseline of 1981-2010

![]()
The UAH (and RSS) maps didn’t find this hot spot.

http://nsstc.uah.edu/climate/2011/april/APRIL%202011.png
Nor did weather underground. GISS reported 28.6C in Concepcion, Paraguay for April, while weather underground reported 25C. Looks like GISS reported about half of South America too high.
Richard Muller at Berkeley recently reported that GISS temperature numbers are golden.

Steve, not the first time either…
There was a huge argument about that same thing, a few years ago. on Dr. Masterbetwetters blog
Notice too, that hot spot appears to be represented by one thermometer.
which begs the question:
Who in their right mind is going to trek into Paraguay to check it?
Hansen is head of GISS, is an active AGW activist and has been arrested several times. Never trust his numbers.
Reporting that the GISS numbers are golden is the BEST possible way to lay those golden eggs of continuing research grants.
I did a very quick, analysis on the GISS data from Bahia Negra in Brazil, which at 20S, 58W is right in the middle of Hansen’s alleged “hot-spot”.
They give the average temperature for April 2011 as 25.9C.
The average temperature at Bahia Negra for April 1951-80 (Gistemp’s base period) was 25.6C, giving an anomaly for April 2011 of +0.3C.
So, where are they getting +2-4C from?
They are counting on no one telling……………..or checking
How dare people attempt to check the results using the scientific method’s principle of validating or refuting the claims. The gall of doing so against the consensus co2 climate doomsday soothsayers is stunning. Don’t you know the planet is doomed? Dr. Hansen, a protege of Nostradamus, prognosticates so.
It was really interesting watching that ~60 minute video of Hansen telling his climate change story, it’s amazing how much of their, ahem be polite, hypothesis is conjectural and lacking hard experimental evidence; it was also very telling that most of it is based on statistical analysis which is wildly open to what methods to apply that change the results. That’s not science, it’s soothsaying using digital math-crystal balls to prognosticate doomsday futures that they “believe” are happening.
It sure would be nice to see hard science with actual experiments in climate science.
Paraguay is not exactly Greenland. There are a fairly good number of weather stations there (and in surrounding areas). The truth should not be that hard to ascertain.
Steve, clearly you can see the lag spot in the satellite graph that will become increasingly warmer in the next 4-8 weeks and settle right over where the GISS hot spot is now. Why must you be so deceptive?
Thanks for the laugh.
What’s puzzling is not that the two maps disagree, but that they disagree only in places. For example they are very similar over the Falklands, and in the ocean in front of Chile. Then one is left wondering if it was hot or not at the Galapagos.
ps I am starting to believe that BEST had to report a substantial agreement otherwise they would have never been allowed to finish with the remaining 98%. In fact, Muller is a figure of hate in the warmosphere.
Steve
You say this
Nor did weather underground. GISS reported 28.6C in Concepcion, Paraguay for April, while weather underground reported 25C. Looks like GISS reported about half of South America too high
Could you take another CLOSER look at this – then report back. I haven’t got time at the moment but I think you mave the WU temp wrong.
WU reported a mean temperature of 77F = 25 C
http://www.wunderground.com/history/station/86134/2011/4/13/MonthlyHistory.html
Ok – I’ve had another look and it does seem likely to be an error in GISS. They do happen, and in my experience, they will be corrected eventually, but let them know if you want.
I can check it out more thoroughly later but what leads me to think that it’s an error is that the Jan/Feb/Mar temps at 23 deg are all lower than the April temperature.
We can argue about the accuracy of GISS forever, but here is the real problem.
http://stevengoddard.wordpress.com/2011/05/14/still-below-scenario-c/
GISS gets its data form NCDC which is very error prone so is unreliable due to lack of quality control. That alone makes all surface station reports unreliable. All the global agencies use the same basic data for their reports with each using their own secret sauce recipes to cook the results.
Garbage In, Garbage Out!
stevengoddard says:
May 14, 2011 at 12:12 pm
We can argue about the accuracy of GISS forever,
Well you started it 🙂
Seriously, though, I think the GISS record is pretty Ok. To use Steve Mosher’s words its “not perfect” but it is “sound”.
but here is the real problem.
http://stevengoddard.wordpress.com/2011/05/14/still-below-scenario-c/
This is obviously a separate issue. I don’t happen to think the catastrophic predictions are right so I don’t agreew ith GHansens projections anyway. Increasing GHGs must make the earth warmer (than it would otherwise be) but on timescales of 10-20 years, this warming could be offset by natural cycles. That said, I will stick up for Hansen a bit here.
In 1988 Hansen predicted warming – and we got warming. He might have got the magnitude wrong but he got the general direction right. Now someone might correct me on this, but I don’t recall at that time any other research group predicting warming on the basis of increased solar activity, ocean oscillations or any other natural cycle. There’s plenty since who have tried to attribute natural factors to the temperature rise and there are one or two who are making predictions about cooling. Let’s see how these play out over the next few years before rubbishing Hansen’s predictions.
Hansen predicted warming while warming was occurring……… that’s kinda trick.
Hansen, by use of algorithms, has a fluid and dynamic historical temp record. No, in my estimation, it doesn’t qualify as “sound”. Mosh is entirely wrong on that account. The system he’s stamped his approval on, its very nature is given to fraud. If you don’t like the outcome, just tweak it a bit. Who could notice? The temps (historical ones) are expected to change! This is why we get the “hottest” evuh so often.
Really, we’re finding reasons to change historical temps in 1934 because we “discovered” something new? They can sell it any way they want to, I’m not buying it.
I predict the world will see a warming or stable temperature (66.6%) or cooling or stable temperature (66.6%) (*).
I can also assure you I will be shown 100% right about “the general direction” for the rest of eternity.
(*) I’m using the Met Office trick, assigning 1/3 probability each to “warming”, “cooling” and “stable”.
Hansen predicted warming while warming was occurring……… that’s kinda trick.
It was in 1988 so quite early on in the warming cycle . There was no obvious reason why the warming should continue.
Certainly none of the solar ‘experts’ who are now “discovering the causes” of the warming gave any indication that
they expected another 20 years warming at that time.
Hansen, by use of algorithms, has a fluid and dynamic historical temp record. No, in my estimation, it doesn’t qualify as “sound”. Mosh is entirely wrong on that account.
I disagree.
The GISS trend is within a whisker of the HadCrut and RSS trends over the past ~30 years. The UAH trend is slightly lower but this appears to relate to a disagreement with the others in the pre-1990 period. Since the early 1990s there is just a few hundredths of a degree covering the trends of all 4 datasets. If Hansen’s tweaking data to make GISS warmer he’s
not making a very good job of it.
And please stop this obsession with 1934 v 1998. Whether or not 2% of the earth’s surface was warmer in 1934 or 1998 is completely irrelevant to the larger picture. It makes no difference whatsoever to the fact that the world has warmed abpout about half a degree since the mid-1970s.
Over the past decade, GISS has diverged from HadCRUT at a rate of 1C per century. Hansen claimed record heat last year by 0.01 degrees. You don’t think that is a problem?
I disagree. Over the last ten years GISS shows temperatures increasing, while HadCRUT shows them decreasing. This is a huge problem due to their Arctic extrapolations. http://stevengoddard.wordpress.com/2011/05/14/why-is-giss-diverging-from-hadcrut/
No Steve that’s because HadCrut isn’t covering the arctic. Here we have 2 scenarios.
1. HadCrut assumes that the arctic has warmed at about the same rate as the Rest of the World over the last 10 years.
2. GISS extrapolates over the arctic and finds it’s warming at a faster rate.
Hence we have a divergence- but which one is right or ‘more right’. Does anyone believe that the arctic has warmed at the same rate as the RoW? Let’s bring in UAH to help us decide.
The 2001-2010 UAH NoPol is ~0.4 deg per decade which is about 6 times the rate of the rest of the world over the same period. HadCrut is clearly under-estimating the warming by omitting the arctic. It’s not only UAH, but arctic
ice melt over the past 10 years implies a much warmer arctic. Then there’s the DMI data. All the indications are that the
arctic has warmed at a much faster rate than the RoW.
The argument against GISS is that it over-estimates arctic warming and maybe this is so over the short term</b?
Because of the low station sample in the arctic the signal will be noisy. There will be times when the stations repeesenting the arctic will be warmer than the arctic as a whole – but , by the same argument, there will be times when they are colder.
It would be highly unlikely if the only arctic warming taking place just happened to be at the arctic weather stations.
we might get a bias over a few years but not over 20-30 years.
In Summary:
HadCrut quite definitely under-estimates arctic/global warming.
GISS possibly over-estimates arctic warming but it is highly unlikely that this will continue over the long term.
Conclusion:
GISS is 'more right' than HadCrut particularly over the longer term.
GISS isn’t covering the Arctic either. They are fabricating numbers for the Arctic
Glc says:
May 15, 2011 at 1:44 pm
Absolutely not. You’re equivocating a proposed systematic error with a random error…huge difference. If I build a parking lot around a thermometer that used to be isolated, there will be an induced error in reading. But it won’t be a mix of hotter/colder, it will be systematically hotter.
Also, there are a few contradictions within your above arguments. For instance, you say that the temp records agree very well with each other, but then you say that HadCRUT underestimates it…which is it? Also, if UAH shows a change of 0.4 C/decade in the Arctic, that should only be 1.2 C in 30 years. Does GISS agree with that, or does it indicate that GISS is severely overestimating the warming there? You’ve also mentioned to wait a few years to see how temps play out but then say that it was early in the warming in 1988. According to Tamino, we were 13 years into the warming in 1988. Heck, it only warmed for another 10-13 years after that. So is a “few year” around a decade then?
On the bright side, you seem to be at least open to discussing actual data and even mention DMI (which hardcore CAGW believers rarely do).
Also on the bright side, at least you admit that Hansen made predictions, and I commend you for that. 🙂
-Scott
I haven’t looked too closely into it but I think, on this occasion, you have found an error in the the GISS data. This repeats what I posted yesterday.
You are right – the WU mean temperature for April is ~25 deg C (I initially though you were looking at the mean for a single day) . Of course it’s possible that WU is wrong but it’s not likly when we consider the GISS Jan-Apr temperature readings for Concepcion (23.6 deg S), i.e.
Jan 27.9
Feb 26.7
Mar 26.0
Apr 28.6
There doesn’t appear to be many (or any) occurrences where April is warmer than March in the Concepcion record let alone warmer than Jan and Feb as well. It’s a bit like October being warmer than June, July AND August in a NH location. It’s almost certainly wrong.
You’re not right about the northern Greenland issue, though. GISS has recorded the correct temperatures at those locations (Nord Ads and Danmarkshavn). I understand your point about those temperatures not being representative of Northern Greenland, but the location and methodology needs to be consistent. There will be times when the station data will be relatively (not necessarily actually) colder than the surrounding areas. Regional errors will be smoothed out over time. You can’t simply change the method because ‘better’ data becomes available else you lose the consistency with previous data – at least you do without making significant adjustments and we all know what a can of worms that can be.
This is incredible…”it was in 1988 so quite early on in the warming cycle”…yeah, right. I see my 66.6% example hasn’t been understood.
lol, yep…. wait, I’m going to get promoted to rock star status. Currently, we’re in a slight cooling trend. I predict this will continue or flatten out in the next decade.
You read it here first!
Responding to Glc…
I said, ” Hansen, by use of algorithms, has a fluid and dynamic historical temp record. No, in my estimation, it doesn’t qualify as “sound”. Mosh is entirely wrong on that account.”
You said, “I disagree.
The GISS trend is within a whisker of the HadCrut and RSS trends over the past ~30 years. ……”
===============================
Glc, consistent results do not mean proper methodology. Read the O’Donnell/Steig debacle.
You also stated, “And please stop this obsession with 1934 v 1998. Whether or not 2% of the earth’s surface was warmer in 1934 or 1998 is completely irrelevant to the larger picture.”
That’s the most ridiculous defense of Hansen, but oft repeated. Glc, you seem like a bright guy, but your reasoning has failed you in this case. Do you really believe this is the only instance of historical data manipulation? Do you really believe Hansen confines the manipulation to only the continental U.S.? Get real.
As to inventing temps in the polar and other isolated areas…..wow, I’m thoroughly amazed that people will attempt to rationalize it. It simply isn’t valid to state something as fact when we clearly don’t know it to be true.
Also on the bright side, at least you admit that Hansen made predictions, and I commend you for that. 🙂
-Scott
===============================
lol, Very nice!
Absolutely not. You’re equivocating a proposed systematic error with a random error…huge difference. If I build a parking lot around a thermometer that used to be isolated, there will be an induced error in reading. But it won’t be a mix of hotter/colder, it will be systematically hotter.
The arctic readings will be random errors – unless you’re aware of any car parks that have been built around arctic stations in the last 10 years.
Also, there are a few contradictions within your above arguments. For instance, you say that the temp records agree very well with each other, but then you say that HadCRUT underestimates it…which is it?
The records agree over the longer term (~30 years). There is a short term divergence between Hadley and GISS
Also, if UAH shows a change of 0.4 C/decade in the Arctic, that should only be 1.2 C in 30 years.
I said [exactwords here] “The 2001-2010 UAH NoPol is ~0.4 deg per decade which is about 6 times the rate of the rest of the world” to be precise, i.e. the trend over the last 10 years. The NoPol trend over the entire UAH record is 0.47 deg per decade. You can get this from the UAH data. The arctic warming according to UAH is more like 1.4-1.5 degrees since ~1980.
Is this the same as GISS? Difficult to say unless we get data for the exact same spatial coverage. If I had to have a stab I’d say GISS arctic warming over the same period is about 1.6-1.7 deg, i.e. about 0.2 deg more.
According to Tamino, we were 13 years into the warming in 1988. Heck, it only warmed for another 10-13 years after that. So is a “few year” around a decade then?
Now you’re posting drivel. It didn’t warm “for another 10-13 years after that”. Thirteen years after 1988 is 2001. The decade 2001-2010 was the warmest on record. It was warmer than 1991-2000 by ~0.2 deg. Only 1998 in the previous decade was higher than any other year in the 2011-2010 period.
Shame you weren’t doing too bad up until that point.
The missing hole in the Arctic is larger than the US. Can you determine the weather in North Dakota based on San Diego? Your straw man arguments are completely bogus.
Uhm, yeh there can be a good argument that the earth has quit warming since 2001.
http://www.woodfortrees.org/plot/hadcrut3gl/from:2001/plot/hadcrut3vgl/from:2001/trend/plot/rss/from:2001/plot/rss/from:2001/trend
Glc says:
May 15, 2011 at 3:57 pm
Pure speculation on your part regarding random errors. The parking lots were just an example, and I’m guessing you know that. Clearly, one could get similar effects from new buildings being nearby, increased human activities in the vicinity, a change in measuring apparatus, etc. It’s hard to imagine random errors giving significant deviations for any period of time longer than a year.
Has their been significant warming since 2001? No. Nice strawman – try counting to from 1988 to 2001 and then repeating 2001 10 times. Did the numbers increase after 2001? No. Just look at the link that suyts provided. It’s funny that you try to get around this by doing decade averages. We have 1 data point starting from 2001 using that level of average. And the first 1/10 of the next data point shows no warming.
Funny, I’d say the exact same thing to you. You did an excellent job up until the last paragraph, and I made some mistakes in my original comment that you caught me on…I even learned stuff from you. However, this comment refers to your last paragraph which is where the wheels fell off.
-Scott
The decade 2001-2010 was the warmest on record
Contrary to a popular myth, years do not start up at 0K on January 1st, rather from whatever temperature it was on December 31st. In other words if the temperature stays more or less the same from one year to the next, one cannot say “it warmed up”, since, as it should be obvious, “remaining at the same temperature” is under no circumstance equivalent to “warming up”.
I am sure were temperatures to go down, Hansen et al would still be arguing that the global reading hadn’t gone as low as x years ago, thereby rethorically trapping us for a long time in a “global warming” situation.
lol, I’ve actually heard that posited. Some pinhead stated we should be in an ice age but man’s polluting has stopped it from occurring. —- I kid you not.
I’ve heard that several times suyts. It’s gone away quite a bit as they try to sweep the ice age scare under the rug, but not everyone got that memo quickly enough. 😉
-Scott
Well, that decade was the warmest in the instrumental record. The issue becomes when people equivocate that with continued warming. If temperatures stay near current levels for the rest of my lifetime, we’ll still be dealing with “hottest on record”, but I doubt there will be any ill effects.
In general, I like the idea of looking at decadal averages, but they have no utility until one reaches thirty years in the data set. Looking at linear trends in an individual decade can also be deceiving. Both the 80s and 90s had major volcanic eruptions early in their decades, cooling temps in the first half and slightly increasing the observed trend. The 00’s did not, and that’s part of the reason one doesn’t see the CAGW believers using the 1-decade trend for that decade (yes, I realize the 80s and 90s would have shown warming without the volcanic eruptions…I’m just saying that they increased the apparent trend).
So if after this La Nina, presume we go back to avg temp of the 00’s and stay ENSO neutral the whole decade. Well, the decade average won’t be any higher than last decade, but we’ll see a slight upward slope, and you can surely bet that the CAGW believers would then point to the trend for the single decade then.
-Scott
Just to pick up on the general points above.
It is true to say that the trend hasn’t risen to a large extent over the last decade or so but that might have somethig to do with the timing of ENSO events. We’ve had 2 La Nina events in the past 3-4 years which has suppressed tmepratures for a lot of that period. I know there was also an El Nino but the duration of the cold phase(s) of the ENSO cycle was (or has been) considerably longer than the warm phase. As we’ve seen over the past few years an ENSO shift can produce a change in temperature of 0.5 deg and more which is enough to significantly offset a ~0.2 warming trend over a 10 year period.
Put it this way – I wouldn’t call the end of warming just yet.
I can definitely agree to that. Though we can’t say it’s continued warming either.
-Scott
Thirteen times No! As long as it doesn’t get any warmER there is no ongoing warmING. Temps might or might not rise again, that’s in the future so irrelevant about the present.
Agreed Omno,
There has not been any significant warming in the last 10 years or so. That said, it doesn’t mean that there’s an end to the warming…it could just be a hiatus. As a lukewarmer, it is my duty 😉 to expect it to continue warming, but at much lower rates than predicted by the doomsdayers.
-Scott
stevengoddard says:
May 15, 2011 at 4:00 pm
The missing hole in the Arctic is larger than the US. Can you determine the weather in North Dakota based on San Diego? Your straw man arguments are completely bogus.
Steve
I’m guessing this is intended for me. It’s getting quite busy on this thread so it’s not that easy to tell.
Of course you can’t “determine the weather in North Dakota based on San Diego” (note I stressed the word ‘weather’). Nor could you determine the North Dakota weather with any confidence on a daily, monthly or even annual basis from, say, 10 different US locations. But I do think you can pin down the general trend over the longer term from a smallish sample of stations – providing those stations are distributed randomly across an area in question (in this case the US).
Look at it this way. For the multi-decadal US temperature trend to be significantly different to the sample trends, the sample would need to have experienced anomalous warming/cooling relative to the rest of the US. With 1 or 2 stations – this is possible; 5 or 6 – less likely; 9 or 10 – you’d be pretty unlucky. The sample will not necessarily track the US on a day-to-day or month-to -month basis and there will be uncertainties but, like the arctic, there would be other sources e.g. satellite which provide support (or otherwise) for the record.
If I get a bit of time I might draw up a list of US stations and create a few groups of 10 randomly selected stations. We can then check how much they differ from each other and how much they differ from the US in general.
I’d be interested in seeing that. Presently, I don’t have time for such an endeavor, but I think you’ll be surprised by your findings. Steve often shows temp trends for states using NCDC, the differences can be striking. I think 10 is a bit optimistic and I think that if it could be done, random wouldn’t have anything to do with it. Just my intuition, but I’ve been wrong before. (I just can’t remember when that happened. 🙂 )
As to satellite to back up temps in the arctic, its my understanding GISS doesn’t use them for such purposes.
I for one would be very interested to see the results of this type of undertaking. It wouldn’t quite be representative of the Arctic, but it’d be a step in the right direction. Perhaps you’d get better results if you only used colder months to more closely simulate the Arctic? Or maybe it’d be better still to use Canada in winter?
-Scott
I see,. So you can determine the temperature trend in International Falls Minnesota based on data from Key West Florida.
No, steve, but I think you know that’s not what I’m saying. I’m saying that you can probably estimate the longer term trend over an area such as the US (or the arctic) using a sample of about 10 randomly selected stations – providing those stations were fairly well distirbuted (i.e. they weren’t all in the same region of the country)
In the Arctic there is a hole larger than the US, with no stations. In Antarctica, trends diverge by several degrees over a few hundred miles.
Yes, the antarctic has even worse coverage than the arctic. O’Donnell and Steig shows that we have only 2 temp stations in the interior and neither have complete continuous records. Its horribly absurd to believe we know what the temp trends are in the antarctic.
http://climateaudit.org/2011/02/07/eric-steigs-trick/
steve,
It doesn’t matter how many comparisons you make highlighting GISS discrepancies, even if it is entire regions. glc is like the Energizer bunny…..he just keeps going and going and going. His goal is to show you what is right with GISS and at the same time ignore and never acknowledge what is wrong; a masterful art of obfuscation.