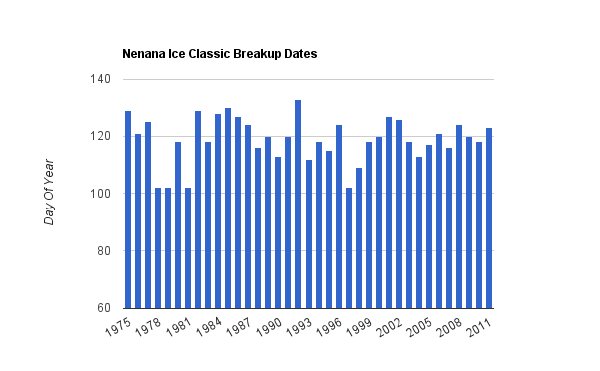
Nenana, Alaska has been tracking the date every year when the ice on their river starts to break free. This year it happened on May 4. The graph above shows the dates since Tamino’s period of modern global warming began in 1975.
There hasn’t been any trend, contrary to this week’s spew of Arctic global warming BS.
http://www.nenanaakiceclassic.com/Tripod%20Days.htm
h/t to Marc Morano


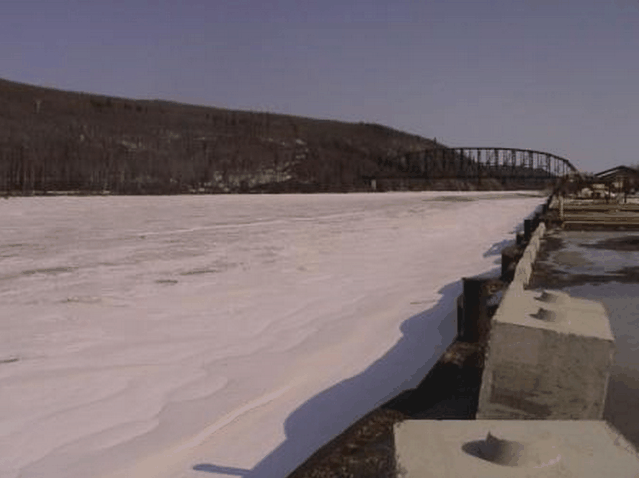
Worth remembering that it is not in pristine wilderness but down stream of Fairbanks, Alaska’s second largest city, with an urban population of 51,926. Obviously no run off problems this year.
The year with the latest breakup seems to coincide with the aftermath of the Mt. Pinatubo eruption in the early 1990’s. It would appear that there is no role that AGW has played whatsoever.
I love the 1975 “modern” date, because it makes so much stuff get thrown out the window (it’s really only useful for the temperature record).
For instance, in another of Tamino’s posts, he claims that there were massive SH sea ice losses back before the 70s due to CAGW. Then, it supposedly stabilizied in the 70’s and since (it actually has gained a little since then, but that’s a drop in the bucket compared to the rest). However, this is in apparent conflict with the idea of a modern AGW. I see three possibilities. First, the SH ice was never as large as Tamino and the proxies claim. Two, the whole idea of a “modern” warming is bogus. Or three, GHG before the 70’s somehow caused massive losses of SH sea ice with little warming, and now the mechanism has changed to no SH sea ice loss with moderate warming.
None of the three jive well with what the CAGW crowd want. Option 1 indicate that ice proxies are crap, so the argument of the late 70’s NH ice being equal to or less than everything before it goes out the window. Option 2 is much worse…if there’s no “modern” warming period, then we have to explain the lack of warming 40s-70s as well as the apparent weak climate sensitivity to CO2. Option 3, on the other hand, might be there saving grace. One would have to show that somehow extra energy mostly went to melting SH sea ice until a certain point caused some sort of shift in patterns to stop melting the ice, thus warming up the rest of the planet. I don’t buy option 3 at all, and it would take some pretty impressive evidence to show it to be true, but I see it as the only way to tie together the claims.
And that’s what I like most about these discussions. Taken individually, certain claims can appear reasonable. But then when that same person makes a seemingly unrelated and reasonable claim, taking them together makes it clear that they are often contradictory. You see this on the CAGW and skeptic sides both. Unless some physical explanation can be given and backed up with ample evidence, one can’t claim that CAGW started in 1975 yet is also due to the supposed massive loss of SH sea ice in the decades prior.
-Scott
Steve – you should’ve coloured the graph hot pink in honour of GISS’s boiling melting frying Arctic.
If I had appropriate software I would overlay an El Nino/La Nine graph on this graph. Just am curious if the roughly match.
Good idea, but I don’t see much correlation there.
The first comment by the Englishman is bizarre, no real runoff problems.. …???what the heck…pristine wilderness… We are surrounded by ideots…..