http://www.ncdc.noaa.gov/oa/climate/research/cag3/state.html
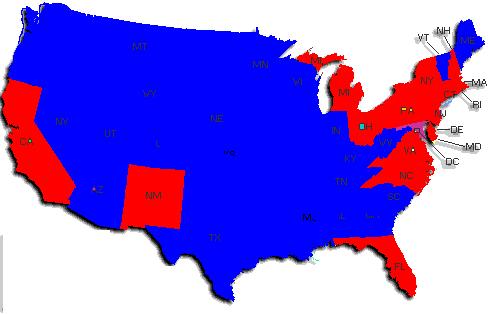
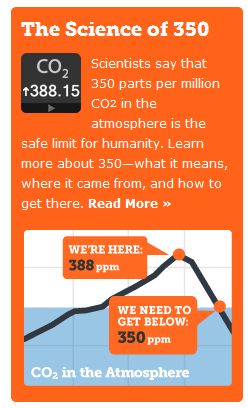
The map above shows in blue, areas of the country which had their hottest year below Hansen’s safe level of 350 ppm. Areas in red had their hottest year above 350 ppm. (Almost all of those occurred in 1998.)
79% of the country had their hottest year when CO2 levels were considered safe from global warming.


Anyone who thinks they can regulate weather or climate is very sadly mistaken.
Colours are wrong way around. Oh wait, that wasn’t the election results…
This rivals the Svensmark billiards hypothesis (ie the solar magnetism->terrestiral magnetism->GCR’s->clouds->temperature 5 cushion shot). Lets make this the ‘progressive reactionary hypothesis’: Economic success->UHIE (and guilt)->temperature->greenery->left voting pattern->less economic success. A sort of political negative feedback climate sensitivity thingy. Cool.
Should disclose that I like Prof Svensmark’s hypothesis. Fits nicely with previous solar cycle length vs temperature correlation.